Diseases and Management of Crops under Protected Cultivation
Diseases and Management of Crops under Protected Cultivation
Diseases and Management of Crops under Protected Cultivation

You also want an ePaper? Increase the reach of your titles
YUMPU automatically turns print PDFs into web optimized ePapers that Google loves.
(<strong>Diseases</strong> <strong>and</strong> <strong>Management</strong> <strong>of</strong> <strong>Crops</strong> <strong>under</strong> <strong>Protected</strong> <strong>Cultivation</strong>)<br />
The crop coefficient (Kc) is "the ratio between ET c , <strong>and</strong> ET o " <strong>and</strong> depends basically on the<br />
crop characteristics, the sowing or planting dates, the development rate <strong>of</strong> the crop, the length <strong>of</strong><br />
the cycle, the climatic conditions <strong>and</strong> the irrigation frequency, especially at the beginning <strong>of</strong> the<br />
cycle (Doorembos et al, 1976).<br />
In greenhouses, the class A pan evaporation method, as well as the radiation (FAO) <strong>and</strong><br />
Priestley-Taylor methods, have been proposed as the more reliable for ET, estimation, for periods<br />
<strong>of</strong> several days (Castilla et al, 1990-B). The difficulty <strong>of</strong> an accurate measurement <strong>of</strong> the wind<br />
inside the greenhouse (Castilla et al, 1990-B) limits the use <strong>of</strong> the Penman method. The ease <strong>of</strong><br />
management <strong>of</strong> the evaporation pan, without sophisticated equipment, is remarkable, but a proper<br />
pan placement is necessary.<br />
The crop coefficient figures for different vegetable crops <strong>under</strong> greenhouses have been<br />
estimated (Castilla, 1989; Castilla et al, 1990-B; Martinez et al, 1990; Veschambre et al, 1980).<br />
When using the class A pan method:<br />
ET o =K p x E o<br />
Kp = pan coefficient<br />
E, = pan evaporation<br />
ET c =Kc x ETo=K c x K p x E o =K x E o … (3)<br />
Where K= K p x K c … (4)<br />
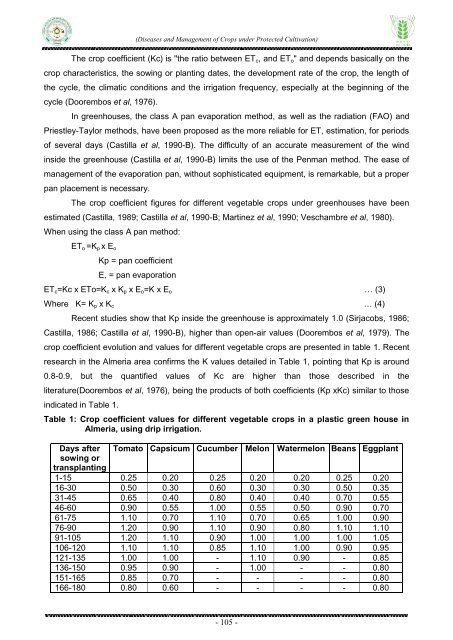
Recent studies show that Kp inside the greenhouse is approximately 1.0 (Sirjacobs, 1986;<br />
Castilla, 1986; Castilla et al, 1990-B), higher than open-air values (Doorembos et al, 1979). The<br />
crop coefficient evolution <strong>and</strong> values for different vegetable crops are presented in table 1. Recent<br />
research in the Almeria area confirms the K values detailed in Table 1, pointing that Kp is around<br />
0.8-0.9, but the quantified values <strong>of</strong> Kc are higher than those described in the<br />
literature(Doorembos et al, 1976), being the products <strong>of</strong> both coefficients (Kp xKc) similar to those<br />
indicated in Table 1.<br />
Table 1: Crop coefficient values for different vegetable crops in a plastic green house in<br />
Almeria, using drip irrigation.<br />
Days after Tomato Capsicum Cucumber Melon Watermelon Beans Eggplant<br />
sowing or<br />
transplanting<br />
1-15 0.25 0.20 0.25 0.20 0.20 0.25 0.20<br />
16-30 0.50 0.30 0.60 0.30 0.30 0.50 0.35<br />
31-45 0.65 0.40 0.80 0.40 0.40 0.70 0.55<br />
46-60 0.90 0.55 1.00 0.55 0.50 0.90 0.70<br />
61-75 1.10 0.70 1.10 0.70 0.65 1.00 0.90<br />
76-90 1.20 0.90 1.10 0.90 0.80 1.10 1.10<br />
91-105 1.20 1.10 0.90 1.00 1.00 1.00 1.05<br />
106-120 1.10 1.10 0.85 1.10 1.00 0.90 0.95<br />
121-135 1.00 1.00 - 1.10 0.90 - 0.85<br />
136-150 0.95 0.90 - 1.00 - - 0.80<br />
151-165 0.85 0.70 - - - - 0.80<br />
166-180 0.80 0.60 - - - - 0.80<br />
- 105 -