- Page 1 and 2:
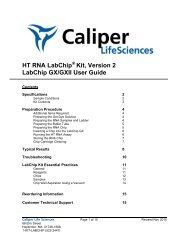
LabChipGX/GX IIUser ManualCopyright
- Page 3 and 4:
Preface 3For support in Europe cont
- Page 5 and 6:
Preface 5Table 1. Important Symbols
- Page 7 and 8:
Instrument Safety 7Required Trainin
- Page 9 and 10:
Instrument Safety 9Laser SafetyWARN
- Page 11 and 12:
Instrument Safety 11InternationalAl
- Page 13 and 14:
Table of Contents 13Viewing the EFs
- Page 15 and 16:
Table of Contents 15Login Window...
- Page 17 and 18:
Introduction 17IntroductionThis man
- Page 19 and 20:
Introduction 19Principles of Operat
- Page 21 and 22:
Operation 21OperationThis section i
- Page 23 and 24:
Operation 23Running an AssayTo star
- Page 25 and 26:
Operation 25Running an Assay (Conti
- Page 27 and 28:
Operation 27Monitoring the RunThe f
- Page 29 and 30:
Operation 29Continuing a Stopped Ru
- Page 31 and 32:
Operation 31Saving Data Files (Cont
- Page 33 and 34:
Operation 33Adding a New Plate (Con
- Page 35 and 36:
Data Analysis 35Data AnalysisAfter
- Page 37 and 38:
Data Analysis 37How the Software An
- Page 39 and 40:
Data Analysis 39How the Software An
- Page 41 and 42:
Data Analysis 41How the Software An
- Page 43 and 44:
Data Analysis 43How the Software An
- Page 45 and 46:
Data Analysis 45How the Software An
- Page 47 and 48:
Data Analysis 47How the Software An
- Page 49 and 50:
Data Analysis 49How the Software An
- Page 51 and 52:
Data Analysis 51Opening a Data File
- Page 53 and 54:
Data Analysis 53Selecting the Wells
- Page 55 and 56:
Data Analysis 55To import the sampl
- Page 57 and 58:
Data Analysis 57Using Expected Frag
- Page 59 and 60:
Data Analysis 59Forcing Expected Pe
- Page 61 and 62:
Data Analysis 61Viewing the EFs/EPs
- Page 63 and 64:
Data Analysis 63Changing the Peak F
- Page 65 and 66:
Data Analysis 65Merging Two PeaksIf
- Page 67 and 68:
Data Analysis 67Using the Default L
- Page 69 and 70:
Data Analysis 69Upper and Lower Mar
- Page 71 and 72:
Data Analysis 71Lower Marker Peaks
- Page 73 and 74:
Data Analysis 73Viewing GelsTo comp
- Page 75 and 76:
Data Analysis 75Adjust Pane WidthsT
- Page 77 and 78:
Data Analysis 77Viewing Graphs in t
- Page 79 and 80:
Data Analysis 79Viewing Multiple Pr
- Page 81 and 82:
Data Analysis 81Reanalyzing a Data
- Page 83 and 84:
Data Analysis 83ElectropherogramCho
- Page 85 and 86:
Data Analysis 85Peak TableChoosing
- Page 87 and 88:
Data Analysis 87Raw DataASCII text
- Page 89 and 90:
Data Analysis 89Exporting Data Manu
- Page 91 and 92: Software Security 91• “Backing
- Page 93 and 94: Software Security 93Managing User A
- Page 95 and 96: Software Security 95Changing User I
- Page 97 and 98: Software Security 97Changing Access
- Page 99 and 100: Software Security 99Setting Policie
- Page 101 and 102: Software Security 101Electronic Sig
- Page 103 and 104: Software Security 103Audit TrailLab
- Page 105 and 106: Software Security 105Exporting the
- Page 107 and 108: Software Security 107Creating New D
- Page 109 and 110: Software Security 109Remote CDR Ser
- Page 111 and 112: Software Security 111Backing Up Dat
- Page 113 and 114: Software Reference 113Software Refe
- Page 115 and 116: Software Reference 115Menu BarThe m
- Page 117 and 118: Software Reference 117Collection Me
- Page 119 and 120: Software Reference 119Security Menu
- Page 121 and 122: Software Reference 121Chip Status a
- Page 123 and 124: Software Reference 123Error Message
- Page 125 and 126: Software Reference 125Rename Plate
- Page 127 and 128: Software Reference 127Collection Pa
- Page 129 and 130: Software Reference 129Graph View (C
- Page 131 and 132: Software Reference 131Active Data T
- Page 133 and 134: Software Reference 133Electropherog
- Page 135 and 136: Software Reference 135OptionText Or
- Page 137 and 138: Software Reference 137Gel View (Con
- Page 139 and 140: Software Reference 139Gel View Prop
- Page 141: Software Reference 141Peak Table Vi
- Page 145 and 146: Software Reference 145Peak Table Vi
- Page 147 and 148: Software Reference 147Filter ViewTh
- Page 149 and 150: Software Reference 149Filter View (
- Page 151 and 152: Software Reference 151Add New Expec
- Page 153 and 154: Software Reference 153Assay Analysi
- Page 155 and 156: Software Reference 155Alignment Tab
- Page 157 and 158: Software Reference 157Analysis Tab
- Page 159 and 160: Software Reference 159Peak Find Tab
- Page 161 and 162: Software Reference 161Table 2. Well
- Page 163 and 164: Software Reference 163Expected Frag
- Page 165 and 166: Software Reference 165Excluded Peak
- Page 167 and 168: Software Reference 167Smear Analysi
- Page 169 and 170: Software Reference 169Titer Tab (Co
- Page 171 and 172: Software Reference 171Advanced TabU
- Page 173 and 174: Software Reference 173Audit Trail W
- Page 175 and 176: Software Reference 175Audit Trail M
- Page 177 and 178: Software Reference 177DeleteButtonH
- Page 179 and 180: Software Reference 179CDR Utility W
- Page 181 and 182: Software Reference 181Change Passwo
- Page 183 and 184: Software Reference 183Event Viewer
- Page 185 and 186: Software Reference 185Export Window
- Page 187 and 188: Software Reference 187Installation
- Page 189 and 190: Software Reference 189Login WindowU
- Page 191 and 192: Software Reference 191Perform Signa
- Page 193 and 194:
Software Reference 193Print WindowU
- Page 195 and 196:
Software Reference 195Print Validat
- Page 197 and 198:
Software Reference 197Run File Edit
- Page 199 and 200:
Software Reference 199Sample Name E
- Page 201 and 202:
Software Reference 201Save Workspac
- Page 203 and 204:
Software Reference 203Start Run Win
- Page 205 and 206:
Software Reference 205Run Tab (Cont
- Page 207 and 208:
Software Reference 207Output Tab (C
- Page 209 and 210:
Software Reference 209Advanced Tab
- Page 211 and 212:
Software Reference 211System Diagno
- Page 213 and 214:
Software Reference 213User Administ
- Page 215 and 216:
Software Reference 215Edit UsersUse
- Page 217 and 218:
Software Reference 217De/Activate U
- Page 219 and 220:
Software Reference 219Show/Hide in
- Page 221 and 222:
LabChip GX Instrument Description 2
- Page 223 and 224:
LabChip GX Instrument Description 2
- Page 225 and 226:
LabChip GX Instrument Description 2
- Page 227 and 228:
LabChip GX Instrument Description 2
- Page 229 and 230:
LabChip GX Instrument Description 2
- Page 231 and 232:
Maintenance and Service 231Maintena
- Page 233 and 234:
Troubleshooting and Diagnostics 233
- Page 235 and 236:
Troubleshooting and Diagnostics 235
- Page 237 and 238:
Troubleshooting and Diagnostics 237
- Page 239 and 240:
Troubleshooting and Diagnostics 239
- Page 241 and 242:
Troubleshooting and Diagnostics 241
- Page 243 and 244:
Troubleshooting and Diagnostics 243
- Page 245 and 246:
Troubleshooting and Diagnostics 245
- Page 247 and 248:
Glossary of Terms 247Glossary of Te
- Page 249 and 250:
Glossary of Terms 249CLAThe file ex
- Page 251 and 252:
Glossary of Terms 251Data Filtering
- Page 253 and 254:
Glossary of Terms 253GXD FilesThe f
- Page 255 and 256:
Glossary of Terms 255Figure 115. Sl
- Page 257 and 258:
Glossary of Terms 257Ladder Analysi
- Page 259 and 260:
Glossary of Terms 259Peak BaselineA
- Page 261 and 262:
Glossary of Terms 261Polynomial Ord
- Page 263 and 264:
Glossary of Terms 263For the purpos
- Page 265 and 266:
Glossary of Terms 265SmearSpecifies
- Page 267 and 268:
Glossary of Terms 267Figure 120. Pr
- Page 269 and 270:
Glossary of Terms 269WorkspaceZero
- Page 271 and 272:
Caliper Life Sciences, Inc. Product
- Page 273 and 274:
Caliper Life Sciences, Inc. Softwar
- Page 275 and 276:
Index 275IndexNumerics21 CFR Part 1
- Page 277 and 278:
Index 277showing. . . . . . . . . .
- Page 279 and 280:
Index 279clearing default ladder .
- Page 281 and 282:
Index 281Remote CDR Server . . . .
- Page 283 and 284:
Index 283Waste wells . . . . . . .