Values
Values
Values

You also want an ePaper? Increase the reach of your titles
YUMPU automatically turns print PDFs into web optimized ePapers that Google loves.
Company | Group Management Group Financial | Corporate Governance | Report of the | Boards/Mandates | Additional Information<br />
Report Statements Supervisory<br />
Board<br />
Income Statement<br />
Statement of Comprehensive Income<br />
Balance Sheet<br />
Cash Flow Statement<br />
Statement of Changes in Equity<br />
Notes<br />
Capital Risk Management<br />
Th e fi nancing guidelines adopted by the Bertelsmann Group<br />
are designed to ensure a balance between fi nancial security,<br />
return on equity and growth. Th e Group’s net indebtedness<br />
is based specifi cally on the requirements for a credit rating<br />
of “BBB+/Baa1.” Bertelsmann’s manages its transactions using<br />
quantifi ed fi nancing objectives that are a central factor<br />
in ensuring the corporation’s independence and capacity<br />
to act. Th ese objectives, as elements of the planning process<br />
and regular monitoring, are part of corporate management.<br />
Th e key performance indicator for limiting economic debt<br />
within the Group is the leverage factor. Th e interest coverage<br />
Interest Rate and Exchange Rate Sensitivity<br />
For the analysis of interest rate risk, a distinction is made between<br />
cash fl ow and present value risks. Financial debt, cash<br />
and cash equivalents and interest rate swaps with variable interest<br />
terms are subject to a greater degree of cash fl ow risk, as<br />
changes in market interest rates have an eff ect on Group’s net<br />
interest income, either immediately or with a short delay.<br />
By contrast, medium- and long-term interest rate agreements<br />
are subject to a greater degree of present value risk. Th e<br />
accounting treatment of present value risks depends on the<br />
respective fi nancial instrument or a hedging relationship documented<br />
in conjunction with a derivative (micro-hedge).<br />
Originated fi nancial debt is always carried at amortized<br />
cost. Changes in fair value are limited to opportunity eff ects, as<br />
changes in interest rates have no eff ect on the balance sheet or<br />
the income statement. Th e recognition of originated fi nancial<br />
debt at fair value is only permitted for transactions for which<br />
Bertelsmann Annual Report 2009<br />
ratio is to remain above 4. Th e equity ratio is not to fall below<br />
25 percent of total assets. Control of these ratios is based on<br />
IFRS guidelines, thus including both shareholders’ equity and<br />
equity attributable to minority interests. Although minority<br />
interests in partnerships represent equity in accordance with<br />
the principle of substance over form, they are classifi ed as debt<br />
for accounting purposes.<br />
In the year under review, the equity ratio amounted to<br />
30.9 percent (previous year: 31.0 percent), meeting the internal<br />
target set by the Group.<br />
a micro-hedge is documented in accordance with IAS 39 in<br />
conjunction with the purchase of an interest rate or exchange<br />
rate hedge involving derivatives. In this case, changes in the fair<br />
value of the respective items are recognized in the income statement<br />
in order to substantially balance out the off setting eff ects<br />
of the fair value measurement of the related derivatives.<br />
For derivative fi nancial instruments, the eff ects of changes<br />
in interest rates are recognized in the income statement. In the<br />
case of documented hedging relationships (cash fl ow hedges),<br />
however, these eff ects are taken directly to equity.<br />
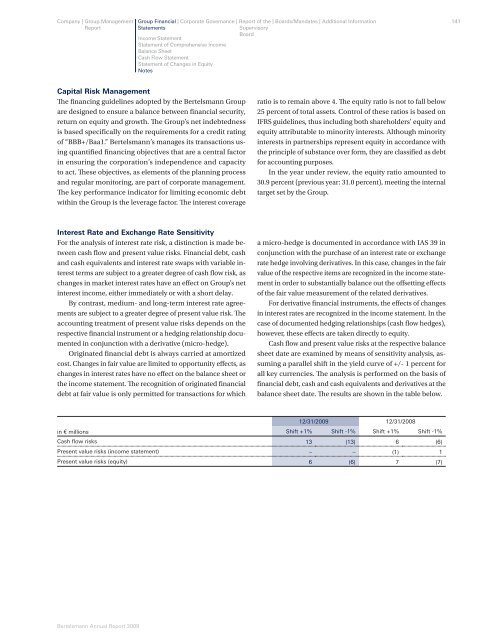
Cash fl ow and present value risks at the respective balance<br />
sheet date are examined by means of sensitivity analysis, assuming<br />
a parallel shift in the yield curve of +/- 1 percent for<br />
all key currencies. Th e analysis is performed on the basis of<br />
fi nancial debt, cash and cash equivalents and derivatives at the<br />
balance sheet date. Th e results are shown in the table below.<br />
12/31/2009 12/31/2008<br />
in € millions Shift +1% Shift -1% Shift +1% Shift -1%<br />
Cash fl ow risks 13 (13) 6 (6)<br />
Present value risks (income statement) – – (1) 1<br />
Present value risks (equity) 6 (6) 7 (7)<br />
141