Getting Started with InfoSphere Data Architect

You also want an ePaper? Increase the reach of your titles
YUMPU automatically turns print PDFs into web optimized ePapers that Google loves.
Chapter 6 – Generating Reports, Importing, and Exporting 113<br />
1. First, add a title to the report:<br />
a. Open the Palette view by clicking the Palette tab, found in the top half of the left pane by<br />
default.<br />
b. From the Palette view, select and drag a Label element into the Layout page of the Report<br />
Editor.<br />
c. Double-click the label in the Report Editor and enter the following text for the label: Table<br />
and column report.<br />
d. In the Property Editor, select the General tab.<br />
e. Set the font weight to bold.<br />
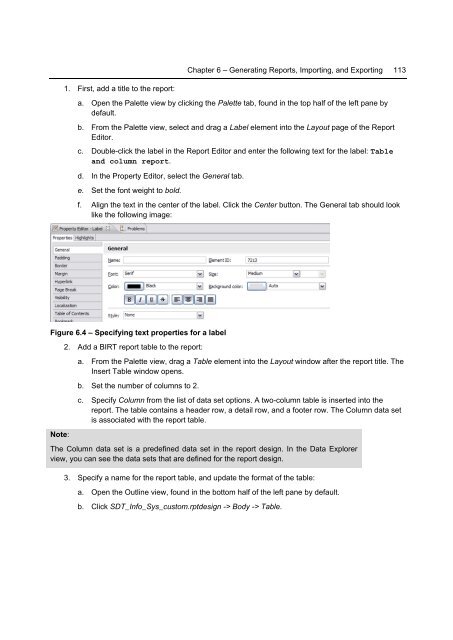
f. Align the text in the center of the label. Click the Center button. The General tab should look<br />
like the following image:<br />
Figure 6.4 – Specifying text properties for a label<br />
Note:<br />
2. Add a BIRT report table to the report:<br />
a. From the Palette view, drag a Table element into the Layout window after the report title. The<br />
Insert Table window opens.<br />
b. Set the number of columns to 2.<br />
c. Specify Column from the list of data set options. A two-column table is inserted into the<br />
report. The table contains a header row, a detail row, and a footer row. The Column data set<br />
is associated <strong>with</strong> the report table.<br />
The Column data set is a predefined data set in the report design. In the <strong>Data</strong> Explorer<br />
view, you can see the data sets that are defined for the report design.<br />
3. Specify a name for the report table, and update the format of the table:<br />
a. Open the Outline view, found in the bottom half of the left pane by default.<br />
b. Click SDT_Info_Sys_custom.rptdesign -> Body -> Table.