Getting Started with InfoSphere Data Architect

Create successful ePaper yourself
Turn your PDF publications into a flip-book with our unique Google optimized e-Paper software.
122 <strong>Getting</strong> started <strong>with</strong> <strong>InfoSphere</strong> <strong>Data</strong> <strong>Architect</strong><br />
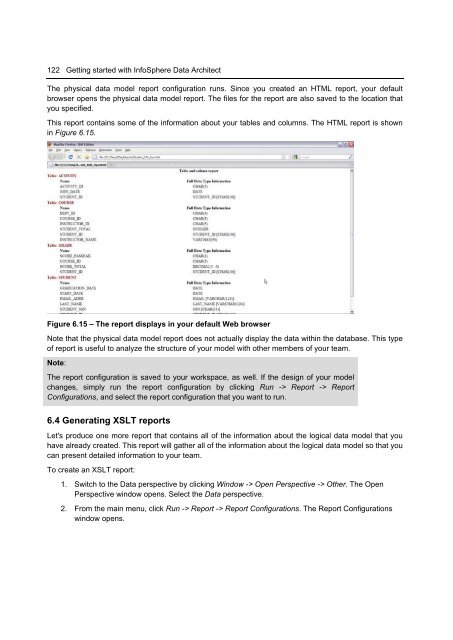
The physical data model report configuration runs. Since you created an HTML report, your default<br />
browser opens the physical data model report. The files for the report are also saved to the location that<br />
you specified.<br />
This report contains some of the information about your tables and columns. The HTML report is shown<br />
in Figure 6.15.<br />
Figure 6.15 – The report displays in your default Web browser<br />
Note that the physical data model report does not actually display the data <strong>with</strong>in the database. This type<br />
of report is useful to analyze the structure of your model <strong>with</strong> other members of your team.<br />
Note:<br />
The report configuration is saved to your workspace, as well. If the design of your model<br />
changes, simply run the report configuration by clicking Run -> Report -> Report<br />
Configurations, and select the report configuration that you want to run.<br />
6.4 Generating XSLT reports<br />
Let's produce one more report that contains all of the information about the logical data model that you<br />
have already created. This report will gather all of the information about the logical data model so that you<br />
can present detailed information to your team.<br />
To create an XSLT report:<br />
1. Switch to the <strong>Data</strong> perspective by clicking Window -> Open Perspective -> Other. The Open<br />
Perspective window opens. Select the <strong>Data</strong> perspective.<br />
2. From the main menu, click Run -> Report -> Report Configurations. The Report Configurations<br />
window opens.