Getting Started with InfoSphere Data Architect

Create successful ePaper yourself
Turn your PDF publications into a flip-book with our unique Google optimized e-Paper software.
120 <strong>Getting</strong> started <strong>with</strong> <strong>InfoSphere</strong> <strong>Data</strong> <strong>Architect</strong><br />
In the report that you have created, you should clearly label tables and columns, so that when you share<br />
this report <strong>with</strong> other members of your team (or business process owners), they will be able to clearly<br />
understand the design of your physical data model.<br />
To format the report:<br />
1. Open the Layout tab of the Report Editor.<br />
2. Create dynamic text for the table header:<br />
a. Delete the [Source Table] element from the group header row.<br />
b. From the Palette, drag a Dynamic Text element into the header cell where you deleted the<br />
[Source Table] element. The Expression Builder window opens.<br />
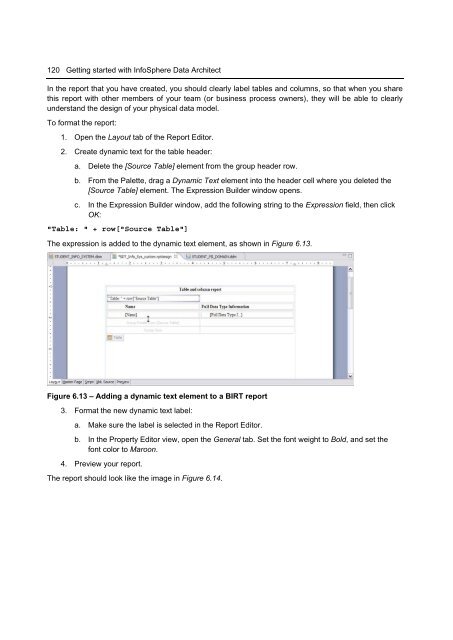
c. In the Expression Builder window, add the following string to the Expression field, then click<br />
OK:<br />
"Table: " + row["Source Table"]<br />
The expression is added to the dynamic text element, as shown in Figure 6.13.<br />
Figure 6.13 – Adding a dynamic text element to a BIRT report<br />
3. Format the new dynamic text label:<br />
a. Make sure the label is selected in the Report Editor.<br />
b. In the Property Editor view, open the General tab. Set the font weight to Bold, and set the<br />
font color to Maroon.<br />
4. Preview your report.<br />
The report should look like the image in Figure 6.14.