

Pedestrian Signal Safety - AAA Foundation for Traffic Safety
Pedestrian Signal Safety - AAA Foundation for Traffic Safety
Pedestrian Signal Safety - AAA Foundation for Traffic Safety

Create successful ePaper yourself
Turn your PDF publications into a flip-book with our unique Google optimized e-Paper software.
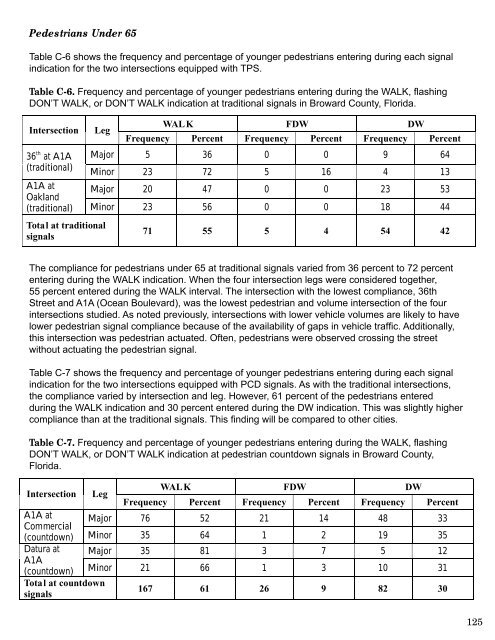
<strong>Pedestrian</strong>s Under 65<br />
Table C-6 shows the frequency and percentage of younger pedestrians entering during each signal<br />
indication <strong>for</strong> the two intersections equipped with TPS.<br />
Table C-6. Frequency and percentage of younger pedestrians entering during the WALK, flashing<br />
DON’T WALK, or DON’T WALK indication at traditional signals in Broward County, Florida.<br />
Intersection Leg<br />
WALK FDW DW<br />
Frequency Percent Frequency Percent Frequency Percent<br />
36 Major 5 36 0 0 9 64<br />
th at A1A<br />
(traditional)<br />
Minor 23 72 5 16 4 13<br />
A1A at<br />
Oakland<br />
Major 20 47 0 0 23 53<br />
(traditional) Minor 23 56 0 0 18 44<br />
Total at traditional<br />
signals<br />
71 55 5 4 54 42<br />
The compliance <strong>for</strong> pedestrians under 65 at traditional signals varied from 36 percent to 72 percent<br />
entering during the WALK indication. When the four intersection legs were considered together,<br />
55 percent entered during the WALK interval. The intersection with the lowest compliance, 36th<br />
Street and A1A (Ocean Boulevard), was the lowest pedestrian and volume intersection of the four<br />
intersections studied. As noted previously, intersections with lower vehicle volumes are likely to have<br />
lower pedestrian signal compliance because of the availability of gaps in vehicle traffic. Additionally,<br />
this intersection was pedestrian actuated. Often, pedestrians were observed crossing the street<br />
without actuating the pedestrian signal.<br />
Table C-7 shows the frequency and percentage of younger pedestrians entering during each signal<br />
indication <strong>for</strong> the two intersections equipped with PCD signals. As with the traditional intersections,<br />
the compliance varied by intersection and leg. However, 61 percent of the pedestrians entered<br />
during the WALK indication and 30 percent entered during the DW indication. This was slightly higher<br />
compliance than at the traditional signals. This finding will be compared to other cities.<br />
Table C-7. Frequency and percentage of younger pedestrians entering during the WALK, flashing<br />
DON’T WALK, or DON’T WALK indication at pedestrian countdown signals in Broward County,<br />
Florida.<br />
Intersection Leg<br />
WALK<br />
Frequency Percent<br />
FDW<br />
Frequency Percent<br />
DW<br />
Frequency Percent<br />
A1A at<br />
Commercial<br />
(countdown)<br />
Major<br />
Minor<br />
76<br />
35<br />
52<br />
64<br />
21<br />
1<br />
14<br />
2<br />
48<br />
19<br />
33<br />
35<br />
Datura at<br />
A1A<br />
(countdown)<br />
Major<br />
Minor<br />
35<br />
21<br />
81<br />
66<br />
3<br />
1<br />
7<br />
3<br />
5<br />
10<br />
12<br />
31<br />
Total at countdown<br />
signals<br />
167 61 26 9 82 30<br />
125


