

Pedestrian Signal Safety - AAA Foundation for Traffic Safety
Pedestrian Signal Safety - AAA Foundation for Traffic Safety
Pedestrian Signal Safety - AAA Foundation for Traffic Safety

Create successful ePaper yourself
Turn your PDF publications into a flip-book with our unique Google optimized e-Paper software.
58<br />
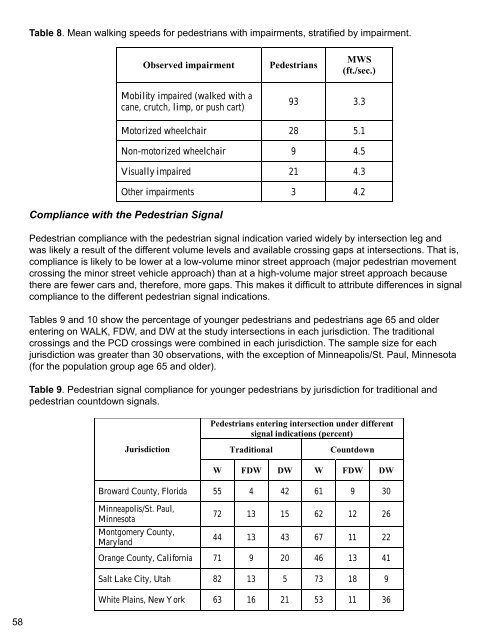
Table 8. Mean walking speeds <strong>for</strong> pedestrians with impairments, stratified by impairment.<br />
Observed impairment <strong>Pedestrian</strong>s<br />
Mobility impaired (walked with a<br />
cane, crutch, limp, or push cart)<br />
MWS<br />
(ft./sec.)<br />
93 3.3<br />
Motorized wheelchair 28 5.1<br />
Non-motorized wheelchair 9 4.5<br />
Visually impaired 21 4.3<br />
Other impairments 3 4.2<br />
Compliance with the <strong>Pedestrian</strong> <strong>Signal</strong><br />
<strong>Pedestrian</strong> compliance with the pedestrian signal indication varied widely by intersection leg and<br />
was likely a result of the different volume levels and available crossing gaps at intersections. That is,<br />
compliance is likely to be lower at a low-volume minor street approach (major pedestrian movement<br />
crossing the minor street vehicle approach) than at a high-volume major street approach because<br />
there are fewer cars and, there<strong>for</strong>e, more gaps. This makes it difficult to attribute differences in signal<br />
compliance to the different pedestrian signal indications.<br />
Tables 9 and 10 show the percentage of younger pedestrians and pedestrians age 65 and older<br />
entering on WALK, FDW, and DW at the study intersections in each jurisdiction. The traditional<br />
crossings and the PCD crossings were combined in each jurisdiction. The sample size <strong>for</strong> each<br />
jurisdiction was greater than 30 observations, with the exception of Minneapolis/St. Paul, Minnesota<br />
(<strong>for</strong> the population group age 65 and older).<br />
Table 9. <strong>Pedestrian</strong> signal compliance <strong>for</strong> younger pedestrians by jurisdiction <strong>for</strong> traditional and<br />
pedestrian countdown signals.<br />
Jurisdiction<br />
<strong>Pedestrian</strong>s entering intersection under different<br />
signal indications (percent)<br />
Traditional Countdown<br />
W FDW DW W FDW DW<br />
Broward County, Florida 55 4 42 61 9 30<br />
Minneapolis/St. Paul,<br />
Minnesota<br />
Montgomery County,<br />
Maryland<br />
72 13 15 62 12 26<br />
44 13 43 67 11 22<br />
Orange County, Cali<strong>for</strong>nia 71 9 20 46 13 41<br />
Salt Lake City, Utah 82 13 5 73 18 9<br />
White Plains, New York 63 16 21 53 11 36


