

Pedestrian Signal Safety - AAA Foundation for Traffic Safety
Pedestrian Signal Safety - AAA Foundation for Traffic Safety
Pedestrian Signal Safety - AAA Foundation for Traffic Safety

You also want an ePaper? Increase the reach of your titles
YUMPU automatically turns print PDFs into web optimized ePapers that Google loves.
The case study intersections in Salt Lake City, Utah and Montgomery County, Maryland had existing<br />
PCTs based on a walking speed greater than 4.00 ft./sec. or a WALK time less than 7 sec.<br />
The available green time is the maximum time that can be allotted to the pedestrian signal interval<br />
based on existing signal timings and phasing. The available green represents the green intervals<br />
<strong>for</strong> the parallel streets. The available green times do not add up to the cycle length because of time<br />
allotted to exclusive phasing <strong>for</strong> turn movements, concurrent phasing <strong>for</strong> approaches on the same<br />
street (such as northbound and southbound approaches), and yellow and red intervals.<br />
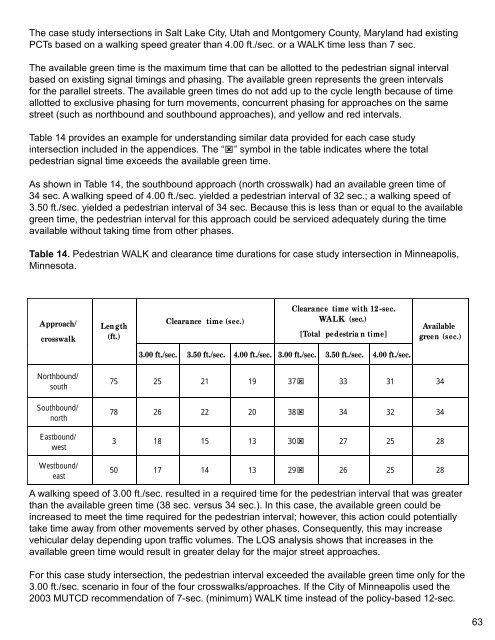
Table 14 provides an example <strong>for</strong> understanding similar data provided <strong>for</strong> each case study<br />
intersection included in the appendices. The “ ˝”<br />
symbol in the table indicates where the total<br />
pedestrian signal time exceeds the available green time.<br />
As shown in Table 14, the southbound approach (north crosswalk) had an available green time of<br />
34 sec. A walking speed of 4.00 ft./sec. yielded a pedestrian interval of 32 sec.; a walking speed of<br />
3.50 ft./sec. yielded a pedestrian interval of 34 sec. Because this is less than or equal to the available<br />
green time, the pedestrian interval <strong>for</strong> this approach could be serviced adequately during the time<br />
available without taking time from other phases.<br />
Table 14. <strong>Pedestrian</strong> WALK and clearance time durations <strong>for</strong> case study intersection in Minneapolis,<br />
Minnesota.<br />
Approach/<br />
crosswalk<br />
Northbound/<br />
south<br />
Southbound/<br />
north<br />
Eastbound/<br />
west<br />
Westbound/<br />
east<br />
Len gth<br />
(ft.)<br />
3.00 ft./sec.<br />
Clearance time (sec.)<br />
3.50 ft./sec. 4.00 ft./sec. 3.00 ft./sec.<br />
Clearance time with 12-sec.<br />
WALK (sec.)<br />
[Total pedestria n time]<br />
3.50 ft./sec. 4.00 ft./sec.<br />
Available<br />
green (sec.)<br />
75 25 21 19 37˝ 33 31 34<br />
78 26 22 20 38˝ 34 32 34<br />
3 18 15 13 30˝ 27 25 28<br />
50 17 14 13 29˝ 26 25 28<br />
A walking speed of 3.00 ft./sec. resulted in a required time <strong>for</strong> the pedestrian interval that was greater<br />
than the available green time (38 sec. versus 34 sec.). In this case, the available green could be<br />
increased to meet the time required <strong>for</strong> the pedestrian interval; however, this action could potentially<br />
take time away from other movements served by other phases. Consequently, this may increase<br />
vehicular delay depending upon traffic volumes. The LOS analysis shows that increases in the<br />
available green time would result in greater delay <strong>for</strong> the major street approaches.<br />
For this case study intersection, the pedestrian interval exceeded the available green time only <strong>for</strong> the<br />
3.00 ft./sec. scenario in four of the four crosswalks/approaches. If the City of Minneapolis used the<br />
2003 MUTCD recommendation of 7-sec. (minimum) WALK time instead of the policy-based 12-sec.<br />
63


