

Pedestrian Signal Safety - AAA Foundation for Traffic Safety
Pedestrian Signal Safety - AAA Foundation for Traffic Safety
Pedestrian Signal Safety - AAA Foundation for Traffic Safety

Create successful ePaper yourself
Turn your PDF publications into a flip-book with our unique Google optimized e-Paper software.
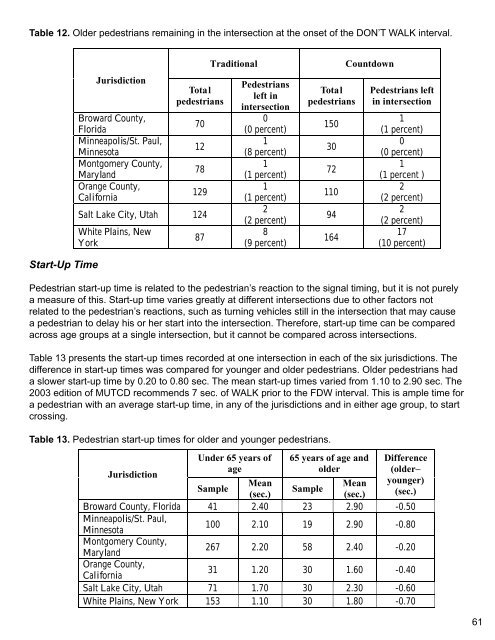
Table 12. Older pedestrians remaining in the intersection at the onset of the DON’T WALK interval.<br />
Start-Up Time<br />
Jurisdiction<br />
Broward County,<br />
Florida<br />
Minneapolis/St. Paul,<br />
Minnesota<br />
Montgomery County,<br />
Maryland<br />
Orange County,<br />
Cali<strong>for</strong>nia<br />
Total<br />
pedestrians<br />
70<br />
12<br />
78<br />
129<br />
Salt Lake City, Utah 124<br />
White Plains, New<br />
York<br />
87<br />
Traditional Countdown<br />
<strong>Pedestrian</strong>s<br />
left in<br />
intersection<br />
0<br />
(0 percent)<br />
1<br />
(8 percent)<br />
1<br />
(1 percent)<br />
1<br />
(1 percent)<br />
2<br />
(2 percent)<br />
8<br />
(9 percent)<br />
Total<br />
pedestrians<br />
150<br />
30<br />
72<br />
110<br />
94<br />
164<br />
<strong>Pedestrian</strong>s left<br />
in intersection<br />
1<br />
(1 percent)<br />
0<br />
(0 percent)<br />
1<br />
(1 percent )<br />
2<br />
(2 percent)<br />
2<br />
(2 percent)<br />
17<br />
(10 percent)<br />
<strong>Pedestrian</strong> start-up time is related to the pedestrian’s reaction to the signal timing, but it is not purely<br />
a measure of this. Start-up time varies greatly at different intersections due to other factors not<br />
related to the pedestrian’s reactions, such as turning vehicles still in the intersection that may cause<br />
a pedestrian to delay his or her start into the intersection. There<strong>for</strong>e, start-up time can be compared<br />
across age groups at a single intersection, but it cannot be compared across intersections.<br />
Table 13 presents the start-up times recorded at one intersection in each of the six jurisdictions. The<br />
difference in start-up times was compared <strong>for</strong> younger and older pedestrians. Older pedestrians had<br />
a slower start-up time by 0.20 to 0.80 sec. The mean start-up times varied from 1.10 to 2.90 sec. The<br />
2003 edition of MUTCD recommends 7 sec. of WALK prior to the FDW interval. This is ample time <strong>for</strong><br />
a pedestrian with an average start-up time, in any of the jurisdictions and in either age group, to start<br />
crossing.<br />
Table 13. <strong>Pedestrian</strong> start-up times <strong>for</strong> older and younger pedestrians.<br />
Under 65 years of 65 years of age and<br />
Jurisdiction<br />
age<br />
Sample<br />
older<br />
Mean<br />
(sec.)<br />
Sample<br />
Mean<br />
Difference<br />
(sec.)<br />
(older–<br />
younger)<br />
(sec.)<br />
Broward County, Florida 41 2.40 23 2.90 -0.50<br />
Minneapolis/St. Paul,<br />
Minnesota<br />
100 2.10 19 2.90 -0.80<br />
Montgomery County,<br />
Maryland<br />
267 2.20 58 2.40 -0.20<br />
Orange County,<br />
Cali<strong>for</strong>nia<br />
31 1.20 30 1.60 -0.40<br />
Salt Lake City, Utah 71 1.70 30 2.30 -0.60<br />
White Plains, New York 153 1.10 30 1.80 -0.70<br />
61


