

Pedestrian Signal Safety - AAA Foundation for Traffic Safety
Pedestrian Signal Safety - AAA Foundation for Traffic Safety
Pedestrian Signal Safety - AAA Foundation for Traffic Safety

Create successful ePaper yourself
Turn your PDF publications into a flip-book with our unique Google optimized e-Paper software.
198<br />
For younger pedestrians, the mean walking speed (MWS) was 4.90 feet/second (ft./sec.) at traditional<br />
intersections and 5.30 ft./sec. at intersections equipped with countdown signals. The 15th-percentile<br />
walking speed represents the slower pedestrians at the intersection. The 15th-percentile speed was<br />
4.30 ft./sec. at traditional signals and 4.70 ft./sec. at countdown signals. A walking speed of 4.00 ft./<br />
sec. would accommodate the 15th-percentile pedestrian under 65 at any of these four intersections.<br />
For older pedestrians, MWS was 4.20 ft./sec. at traditional intersections and 4.30 ft./sec. at<br />
intersections equipped with countdown signals. The 15th-percentile walking speed represents the<br />
slower pedestrians at the intersection. The 15th-percentile speed was 3.40 ft./sec. at traditional<br />
signals and 3.50 ft./sec. at countdown signals. A walking speed of 4.00 ft./sec. would not<br />
accommodate the 15th-percentile pedestrian 65 and older at any these intersections.<br />
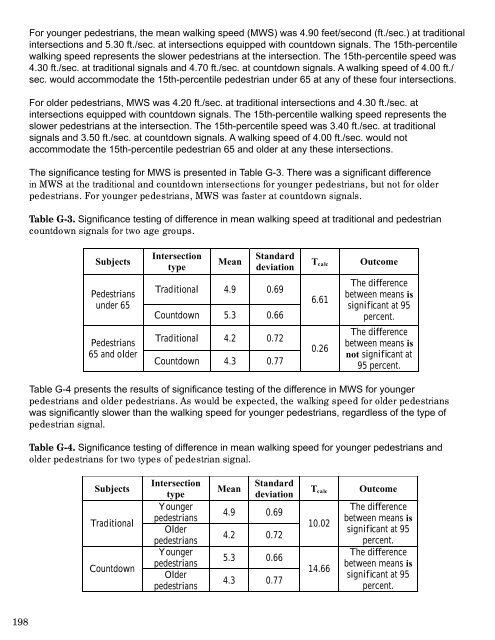
The significance testing <strong>for</strong> MWS is presented in Table G-3. There was a significant difference<br />
in MWS at the traditional and countdown intersections <strong>for</strong> younger pedestrians, but not <strong>for</strong> older<br />
pedestrians. For younger pedestrians, MWS was faster at countdown signals.<br />
Table G-3. Significance testing of difference in mean walking speed at traditional and pedestrian<br />
countdown signals <strong>for</strong> two age groups.<br />
Subjects<br />
<strong>Pedestrian</strong>s<br />
under 65<br />
<strong>Pedestrian</strong>s<br />
65 and older<br />
Intersection<br />
type<br />
Mean<br />
Standard<br />
deviation<br />
Traditional 4.9 0.69<br />
Countdown 5.3 0.66<br />
Traditional 4.2 0.72<br />
Countdown 4.3 0.77<br />
Tcalc<br />
6.61<br />
0.26<br />
Outcome<br />
The difference<br />
between means is<br />
significant at 95<br />
percent.<br />
The difference<br />
between means is<br />
not significant at<br />
95 percent.<br />
Table G-4 presents the results of significance testing of the difference in MWS <strong>for</strong> younger<br />
pedestrians and older pedestrians. As would be expected, the walking speed <strong>for</strong> older pedestrians<br />
was significantly slower than the walking speed <strong>for</strong> younger pedestrians, regardless of the type of<br />
pedestrian signal.<br />
Table G-4. Significance testing of difference in mean walking speed <strong>for</strong> younger pedestrians and<br />
older pedestrians <strong>for</strong> two types of pedestrian signal.<br />
Subjects<br />
Traditional<br />
Countdown<br />
Intersection<br />
type<br />
Younger<br />
pedestrians<br />
Older<br />
pedestrians<br />
Younger<br />
pedestrians<br />
Older<br />
pedestrians<br />
Mean<br />
Standard<br />
deviation<br />
4.9 0.69<br />
4.2 0.72<br />
5.3 0.66<br />
4.3 0.77<br />
Tcalc<br />
10.02<br />
14.66<br />
Outcome<br />
The difference<br />
between means is<br />
significant at 95<br />
percent.<br />
The difference<br />
between means is<br />
significant at 95<br />
percent.


