

Pedestrian Signal Safety - AAA Foundation for Traffic Safety
Pedestrian Signal Safety - AAA Foundation for Traffic Safety
Pedestrian Signal Safety - AAA Foundation for Traffic Safety

You also want an ePaper? Increase the reach of your titles
YUMPU automatically turns print PDFs into web optimized ePapers that Google loves.
cross. That is, at an intersection with low vehicle volume, pedestrians are more likely to violate the<br />
pedestrian signal because there are more available crossing gaps.<br />
Younger <strong>Pedestrian</strong>s<br />
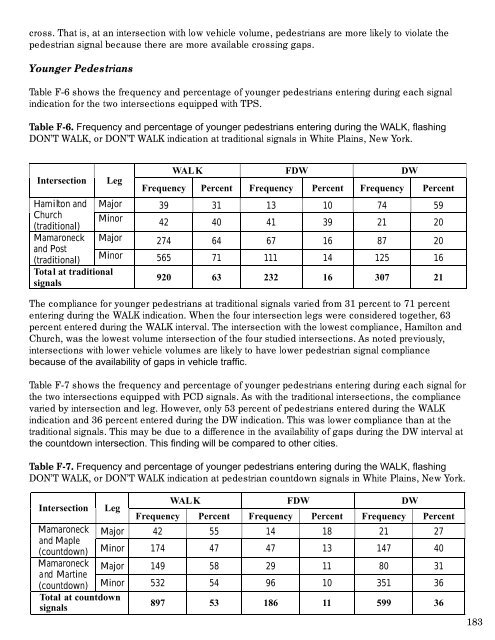
Table F-6 shows the frequency and percentage of younger pedestrians entering during each signal<br />
indication <strong>for</strong> the two intersections equipped with TPS.<br />
Table F-6. Frequency and percentage of younger pedestrians entering during the WALK, flashing<br />
DON’T WALK, or DON’T WALK indication at traditional signals in White Plains, New York.<br />
Intersection Leg<br />
WALK FDW DW<br />
Frequency Percent Frequency Percent Frequency Percent<br />
Hamilton and<br />
Church<br />
(traditional)<br />
Major 39 31 13 10 74 59<br />
Minor 42 40 41 39 21 20<br />
Mamaroneck<br />
and Post<br />
(traditional)<br />
Major 274 64 67 16 87 20<br />
Minor 565 71 111 14 125 16<br />
Total at traditional<br />
signals<br />
920 63 232 16 307 21<br />
The compliance <strong>for</strong> younger pedestrians at traditional signals varied from 31 percent to 71 percent<br />
entering during the WALK indication. When the four intersection legs were considered together, 63<br />
percent entered during the WALK interval. The intersection with the lowest compliance, Hamilton and<br />
Church, was the lowest volume intersection of the four studied intersections. As noted previously,<br />
intersections with lower vehicle volumes are likely to have lower pedestrian signal compliance<br />
because of the availability of gaps in vehicle traffic.<br />
Table F-7 shows the frequency and percentage of younger pedestrians entering during each signal <strong>for</strong><br />
the two intersections equipped with PCD signals. As with the traditional intersections, the compliance<br />
varied by intersection and leg. However, only 53 percent of pedestrians entered during the WALK<br />
indication and 36 percent entered during the DW indication. This was lower compliance than at the<br />
traditional signals. This may be due to a difference in the availability of gaps during the DW interval at<br />
the countdown intersection. This finding will be compared to other cities.<br />
Table F-7. Frequency and percentage of younger pedestrians entering during the WALK, flashing<br />
DON’T WALK, or DON’T WALK indication at pedestrian countdown signals in White Plains, New York.<br />
Intersection Leg<br />
Mamaroneck<br />
and Maple<br />
(countdown)<br />
Mamaroneck<br />
and Martine (countdown)<br />
Total at countdown<br />
signals<br />
WALK FDW DW<br />
Frequency Percent Frequency Percent Frequency Percent<br />
Major 42 55 14 18 21 27<br />
Minor 174 47 47 13 147 40<br />
Major 149 58 29 11 80 31<br />
Minor 532 54 96 10 351 36<br />
897 53 186 11 599 36<br />
183


