

Pedestrian Signal Safety - AAA Foundation for Traffic Safety
Pedestrian Signal Safety - AAA Foundation for Traffic Safety
Pedestrian Signal Safety - AAA Foundation for Traffic Safety

Create successful ePaper yourself
Turn your PDF publications into a flip-book with our unique Google optimized e-Paper software.
148<br />
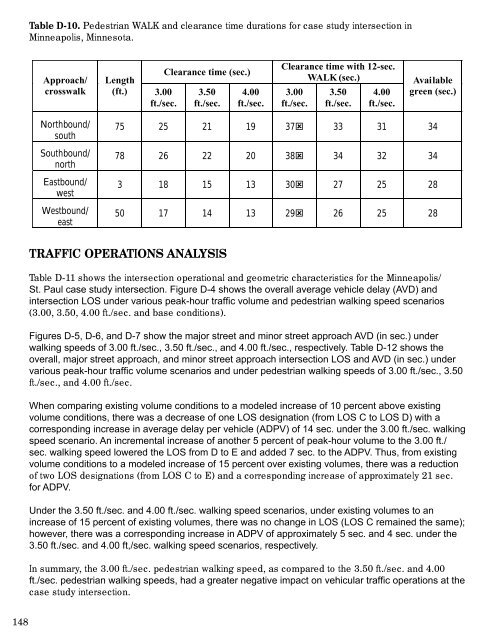
Table D-10. <strong>Pedestrian</strong> WALK and clearance time durations <strong>for</strong> case study intersection in<br />
Minneapolis, Minnesota.<br />
Approach/<br />
crosswalk<br />
Northbound/<br />
south<br />
Southbound/<br />
north<br />
Eastbound/<br />
west<br />
Westbound/<br />
east<br />
Length<br />
(ft.) 3.00<br />
ft./sec.<br />
Clearance time (sec.)<br />
3.50<br />
ft./sec.<br />
4.00<br />
ft./sec.<br />
Clearance time with 12-sec.<br />
WALK (sec.)<br />
3.00<br />
ft./sec.<br />
3.50<br />
ft./sec.<br />
4.00<br />
ft./sec.<br />
Available<br />
green (sec.)<br />
75 25 21 19 37˝ 33 31 34<br />
78 26 22 20 38˝ 34 32 34<br />
3 18 15 13 30˝ 27 25 28<br />
50 17 14 13 29˝ 26 25 28<br />
TRAFFIC OPERATIONS ANALYSIS<br />
Table D-11 shows the intersection operational and geometric characteristics <strong>for</strong> the Minneapolis/<br />
St. Paul case study intersection. Figure D-4 shows the overall average vehicle delay (AVD) and<br />
intersection LOS under various peak-hour traffic volume and pedestrian walking speed scenarios<br />
(3.00, 3.50, 4.00 ft./sec. and base conditions).<br />
Figures D-5, D-6, and D-7 show the major street and minor street approach AVD (in sec.) under<br />
walking speeds of 3.00 ft./sec., 3.50 ft./sec., and 4.00 ft./sec., respectively. Table D-12 shows the<br />
overall, major street approach, and minor street approach intersection LOS and AVD (in sec.) under<br />
various peak-hour traffic volume scenarios and under pedestrian walking speeds of 3.00 ft./sec., 3.50<br />
ft./sec., and 4.00 ft./sec.<br />
When comparing existing volume conditions to a modeled increase of 10 percent above existing<br />
volume conditions, there was a decrease of one LOS designation (from LOS C to LOS D) with a<br />
corresponding increase in average delay per vehicle (ADPV) of 14 sec. under the 3.00 ft./sec. walking<br />
speed scenario. An incremental increase of another 5 percent of peak-hour volume to the 3.00 ft./<br />
sec. walking speed lowered the LOS from D to E and added 7 sec. to the ADPV. Thus, from existing<br />
volume conditions to a modeled increase of 15 percent over existing volumes, there was a reduction<br />
of two LOS designations (from LOS C to E) and a corresponding increase of approximately 21 sec.<br />
<strong>for</strong> ADPV.<br />
Under the 3.50 ft./sec. and 4.00 ft./sec. walking speed scenarios, under existing volumes to an<br />
increase of 15 percent of existing volumes, there was no change in LOS (LOS C remained the same);<br />
however, there was a corresponding increase in ADPV of approximately 5 sec. and 4 sec. under the<br />
3.50 ft./sec. and 4.00 ft,/sec. walking speed scenarios, respectively.<br />
In summary, the 3.00 ft./sec. pedestrian walking speed, as compared to the 3.50 ft./sec. and 4.00<br />
ft./sec. pedestrian walking speeds, had a greater negative impact on vehicular traffic operations at the<br />
case study intersection.


