

Pedestrian Signal Safety - AAA Foundation for Traffic Safety
Pedestrian Signal Safety - AAA Foundation for Traffic Safety
Pedestrian Signal Safety - AAA Foundation for Traffic Safety

Create successful ePaper yourself
Turn your PDF publications into a flip-book with our unique Google optimized e-Paper software.
218<br />
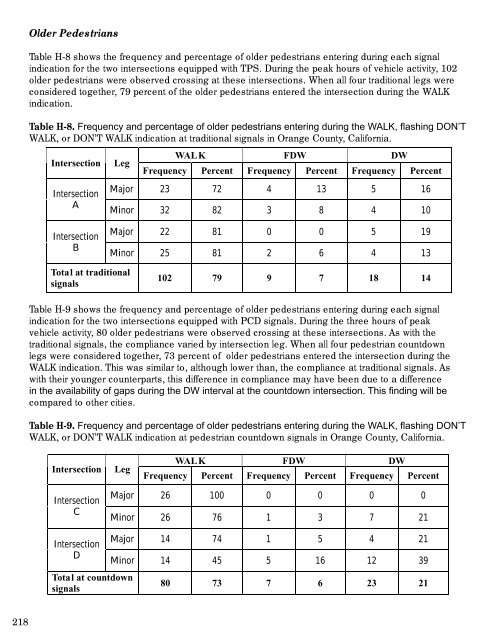
Older <strong>Pedestrian</strong>s<br />
Table H-8 shows the frequency and percentage of older pedestrians entering during each signal<br />
indication <strong>for</strong> the two intersections equipped with TPS. During the peak hours of vehicle activity, 102<br />
older pedestrians were observed crossing at these intersections. When all four traditional legs were<br />
considered together, 79 percent of the older pedestrians entered the intersection during the WALK<br />
indication.<br />
Table H-8. Frequency and percentage of older pedestrians entering during the WALK, flashing DON’T<br />
WALK, or DON’T WALK indication at traditional signals in Orange County, Cali<strong>for</strong>nia.<br />
WALK FDW DW<br />
Intersection Leg Frequency Percent Frequency Percent Frequency Percent<br />
Intersection<br />
A<br />
Intersection<br />
B<br />
Total at traditional<br />
signals<br />
Major 23 72 4 13 5 16<br />
Minor 32 82 3 8 4 10<br />
Major 22 81 0 0 5 19<br />
Minor 25 81 2 6 4 13<br />
102 79 9 7 18 14<br />
Table H-9 shows the frequency and percentage of older pedestrians entering during each signal<br />
indication <strong>for</strong> the two intersections equipped with PCD signals. During the three hours of peak<br />
vehicle activity, 80 older pedestrians were observed crossing at these intersections. As with the<br />
traditional signals, the compliance varied by intersection leg. When all four pedestrian countdown<br />
legs were considered together, 73 percent of older pedestrians entered the intersection during the<br />
WALK indication. This was similar to, although lower than, the compliance at traditional signals. As<br />
with their younger counterparts, this difference in compliance may have been due to a difference<br />
in the availability of gaps during the DW interval at the countdown intersection. This finding will be<br />
compared to other cities.<br />
Table H-9. Frequency and percentage of older pedestrians entering during the WALK, flashing DON’T<br />
WALK, or DON’T WALK indication at pedestrian countdown signals in Orange County, Cali<strong>for</strong>nia.<br />
WALK FDW DW<br />
Intersection Leg Frequency Percent Frequency Percent Frequency Percent<br />
Intersection<br />
C<br />
Intersection<br />
D<br />
Total at countdown<br />
signals<br />
Major 26 100 0 0 0 0<br />
Minor 26 76 1 3 7 21<br />
Major 14 74 1 5 4 21<br />
Minor 14 45 5 16 12 39<br />
80 73 7 6 23 21


