

Pedestrian Signal Safety - AAA Foundation for Traffic Safety
Pedestrian Signal Safety - AAA Foundation for Traffic Safety
Pedestrian Signal Safety - AAA Foundation for Traffic Safety

You also want an ePaper? Increase the reach of your titles
YUMPU automatically turns print PDFs into web optimized ePapers that Google loves.
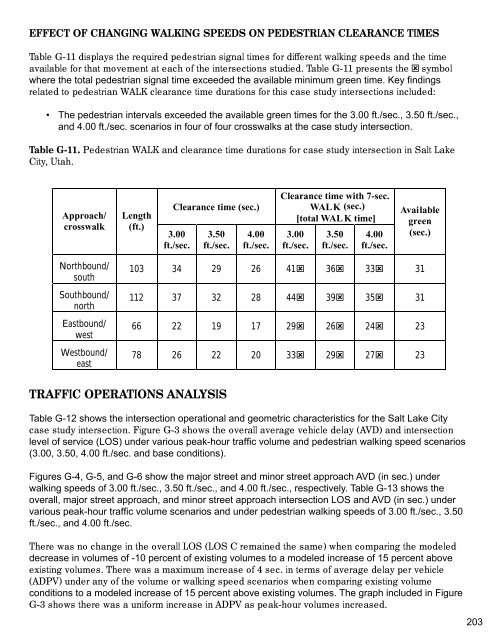
EFFECT OF CHANGING WALKING SPEEDS ON PEDESTRIAN CLEARANCE TIMES<br />
Table G-11 displays the required pedestrian signal times <strong>for</strong> different walking speeds and the time<br />
available <strong>for</strong> that movement at each of the intersections studied. Table G-11 presents the ˝ symbol<br />
where the total pedestrian signal time exceeded the available minimum green time. Key findings<br />
related to pedestrian WALK clearance time durations <strong>for</strong> this case study intersections included:<br />
• The pedestrian intervals exceeded the available green times <strong>for</strong> the 3.00 ft./sec., 3.50 ft./sec.,<br />
and 4.00 ft./sec. scenarios in four of four crosswalks at the case study intersection.<br />
Table G-11. <strong>Pedestrian</strong> WALK and clearance time durations <strong>for</strong> case study intersection in Salt Lake<br />
City, Utah.<br />
Approach/<br />
crosswalk<br />
Northbound/<br />
south<br />
Southbound/<br />
north<br />
Eastbound/<br />
west<br />
Westbound/<br />
east<br />
Length<br />
(ft.)<br />
Clearance time (sec.)<br />
3.00<br />
ft./sec.<br />
3.50<br />
ft./sec.<br />
TRAFFIC OPERATIONS ANALYSIS<br />
4.00<br />
ft./sec.<br />
Clearance time with 7-sec.<br />
WALK (sec.)<br />
[total WAL K time]<br />
3.00<br />
ft./sec.<br />
3.50<br />
ft./sec.<br />
4.00<br />
ft./sec.<br />
Available<br />
green<br />
(sec.)<br />
103 34 29 26 41˝ 36˝ 33˝ 31<br />
112 37 32 28 44˝ 39˝ 35˝ 31<br />
66 22 19 17 29˝ 26˝ 24˝ 23<br />
78 26 22 20 33˝ 29˝ 27˝ 23<br />
Table G-12 shows the intersection operational and geometric characteristics <strong>for</strong> the Salt Lake City<br />
case study intersection. Figure G-3 shows the overall average vehicle delay (AVD) and intersection<br />
level of service (LOS) under various peak-hour traffic volume and pedestrian walking speed scenarios<br />
(3.00, 3.50, 4.00 ft./sec. and base conditions).<br />
Figures G-4, G-5, and G-6 show the major street and minor street approach AVD (in sec.) under<br />
walking speeds of 3.00 ft./sec., 3.50 ft./sec., and 4.00 ft./sec., respectively. Table G-13 shows the<br />
overall, major street approach, and minor street approach intersection LOS and AVD (in sec.) under<br />
various peak-hour traffic volume scenarios and under pedestrian walking speeds of 3.00 ft./sec., 3.50<br />
ft./sec., and 4.00 ft./sec.<br />
There was no change in the overall LOS (LOS C remained the same) when comparing the modeled<br />
decrease in volumes of -10 percent of existing volumes to a modeled increase of 15 percent above<br />
existing volumes. There was a maximum increase of 4 sec. in terms of average delay per vehicle<br />
(ADPV) under any of the volume or walking speed scenarios when comparing existing volume<br />
conditions to a modeled increase of 15 percent above existing volumes. The graph included in Figure<br />
G-3 shows there was a uni<strong>for</strong>m increase in ADPV as peak-hour volumes increased.<br />
203


