- Page 1 and 2:
Operational Plan for the Restoratio
- Page 3 and 4:
Table of Contents Introduction ....
- Page 5 and 6:
Introduction The overarching goal o
- Page 7 and 8:
Section 1 - Alewife, American eel,
- Page 9 and 10:
Introduction Five species (shortnos
- Page 11 and 12:
3.0 Objective: Rebuild the rainbow
- Page 13 and 14:
Table 1. List of lakes above Veazie
- Page 15 and 16:
Figure 1. Alewife Phase 1 habitat (
- Page 17 and 18:
Table 2. River habitat that histori
- Page 19 and 20:
Work Plan Table The budget includes
- Page 21 and 22:
3.1.3, 3.2.1, and 3.3.1 Estimate th
- Page 23 and 24:
USFWS (Seavey). Analysis may includ
- Page 25 and 26:
A boat electrofishing survey (Yoder
- Page 27 and 28:
Table 5. Results of natural recolon
- Page 29 and 30:
Because adult shad mortality increa
- Page 31 and 32:
11.0 Rebuild the striped bass popul
- Page 33 and 34:
meta-population. Based on watershed
- Page 35 and 36:
Objective 12: Increase wild/natural
- Page 37 and 38:
Work Plan Table The budget includes
- Page 39 and 40:
14.1.2 14.1.3 14.2.1 14.2.2 14.2.3
- Page 41 and 42:
12.1.4 Operate the adult Atlantic s
- Page 43 and 44:
12.6.1 Proposal to investigate natu
- Page 45 and 46:
the ability to target specific area
- Page 47 and 48:
occur. Assessment is likely to incl
- Page 49 and 50:
smolts needs to be documented (Task
- Page 51 and 52:
Section 2 - Passage and Connectivit
- Page 53 and 54:
Atlantic salmon. Two dams on the St
- Page 55 and 56:
On the tributaries, the downstream
- Page 57 and 58:
can prevent the successful downstre
- Page 59 and 60:
ensure maximum emigration of target
- Page 61 and 62:
18.1.2 Strategy: Develop/conduct as
- Page 63 and 64:
21.1.1 Strategy: Develop a Memorand
- Page 65 and 66:
17.1.6 17.2.1 17.2.2 17.2.3 17.2.4
- Page 67 and 68:
17.6.5 17.6.6 17.6.7 18.1.1 18.1.2
- Page 69 and 70:
20.1.6 20.1.7 20.1.8 20.1.9 20.2.1
- Page 71 and 72:
Over the past 20 years, there have
- Page 73 and 74:
that address fish passage. Similarl
- Page 75 and 76:
17.2.4 Assess Fish Passage Improvem
- Page 77 and 78:
17.5.1 Review the FERC License and
- Page 79 and 80:
18.1.1 Review Need and Process to I
- Page 81 and 82:
19.1.4 Consult and/or Partner with
- Page 83 and 84:
goals, DMR will need to work with l
- Page 85 and 86:
21.1.5 Develop Memorandum of Unders
- Page 87 and 88:
Section 3 - Habitat PRFP Page 83
- Page 89 and 90:
Hydrology Riparian and organic inpu
- Page 91 and 92: 22.8 Strategy: Undertake an IFIM to
- Page 93 and 94: Work Plan Narratives 22.1 Expand US
- Page 95 and 96: Recent surveys in coastal Maine riv
- Page 97 and 98: Section 4 - Non-Native species incl
- Page 99 and 100: 23.1.1.1.1.2 East Branch Pond, whic
- Page 101 and 102: Investigate and maintain current bl
- Page 103 and 104: The dam at Schoodic Lake has a 6’
- Page 105 and 106: Work with IFW regional biologists t
- Page 107 and 108: Authors: Joan Trial and Melissa Las
- Page 109 and 110: Objective 28: Support regional and
- Page 111 and 112: Coordinate data collection and shar
- Page 113 and 114: Work Plan Narratives 26.1. Convene
- Page 115 and 116: 27.5 Hold an interagency technical
- Page 117 and 118: River Restoration Trust (PRRT or Tr
- Page 119 and 120: Appendices Appendix A - Role of Hat
- Page 121 and 122: Population Structure The ‘concept
- Page 123 and 124: supplementation have been highly su
- Page 125 and 126: 3. Blueback Herring Meristic/Morpho
- Page 127 and 128: populations, Waldman et al. (1996)
- Page 129 and 130: Summary No specific information is
- Page 131 and 132: References Anderson, M.G., Vickery,
- Page 133 and 134: Cumberland Basin, New Brunswick. Ph
- Page 135 and 136: Table 1. Sub-drainage and reaches i
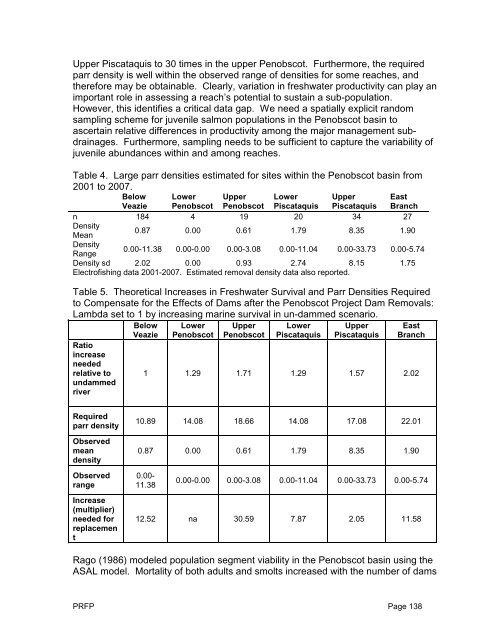
- Page 137 and 138: itself verses mortality that may oc
- Page 139 and 140: We estimated cumulative dam mortali
- Page 141: Female Returns 16000 14000 12000 10
- Page 145 and 146: Appendix C - Penobscot Habitat and
- Page 147 and 148: Parr density (no. / 100 m 2 ) 45 40
- Page 149 and 150: Enfield Weldon to West Enfield Matt
- Page 151 and 152: Habitat (units) Parr Production Hab
- Page 153 and 154: Figure 8. Optimal parr production s
- Page 155 and 156: Subwatershed Dam Reach Management R
- Page 157 and 158: Subwatershed Dam Reach Management R
- Page 159 and 160: Subwatershed Dam Reach Management R
- Page 161 and 162: Subwatershed Dam Reach Management R
- Page 163 and 164: Subwatershed Dam Reach Management R
- Page 165 and 166: Subwatershed Dam Reach Management R
- Page 167 and 168: lakes fisheries: a general review a
- Page 169 and 170: ecommended adjustments. While other
- Page 171 and 172: Major flexibility constraints of th
- Page 173 and 174: Table 6. Continued. YOY Parr Result
- Page 175 and 176: Appendix E - Atlantic Salmon Fisher
- Page 177 and 178: easonably be accessed; and 4) minim
- Page 179 and 180: Approximately 600,000 smolts are st
- Page 181 and 182: operations. Adult fish reared speci
- Page 183 and 184: Methods We chose to divide the Peno
- Page 185 and 186: • Measure 1b: Sub-drainages with
- Page 187 and 188: Objective 3: Discontinue supplement
- Page 189 and 190: � Strategy- Assess environmental
- Page 191 and 192: Appendix G - Habitat Survey and Ass
- Page 193 and 194:
elated to diadromous fishes upstrea
- Page 195 and 196:
designs (GRTS), where samples are r
- Page 197 and 198:
with panels starting in year 1, 2,
- Page 199 and 200:
incorporate further refinements unt
- Page 201 and 202:
in statistical analyses stratum Str
- Page 203 and 204:
Appendix I - Downstream Passage Stu
- Page 205 and 206:
MILFORD (FERC No. 2534) Project Des
- Page 207 and 208:
Bangor-Pacific Hydro Associates. 19
- Page 209 and 210:
Shepard, S.L. and S.D. Hall. 1991.
- Page 211 and 212:
Options under the Multiparty Settle
- Page 213 and 214:
As a result of the discussion at th
- Page 215 and 216:
By 2000, PPL (new owner of the dams
- Page 217 and 218:
arriers to prevent movement of pike
- Page 219 and 220:
Kennebec 2008 WhittierPond Vienna N
- Page 221 and 222:
are a coldwater species and need ac
- Page 223 and 224:
Figure 4. Total species composition
- Page 225 and 226:
northern pike (Lucas 2008, Scott an
- Page 227 and 228:
Above1 Run 16.3 551 7 FLF, YLP, WHS
- Page 229 and 230:
any given water. During warmer peri
- Page 231 and 232:
In Maine, lake trout feed primarily
- Page 233 and 234:
Piscataquis drainage will likely of
- Page 235 and 236:
approximately 14°C”. These tempe
- Page 237 and 238:
cover, and aquatic macrophytes are
- Page 239 and 240:
and 2) the availability of data in
- Page 241 and 242:
Table 5 Northern Pike Waterway Habi
- Page 243 and 244:
4. The 40 largest watebodies in the
- Page 245 and 246:
5. About 97 percent of the rivers a
- Page 247 and 248:
Human-Caused Introductions Backgrou
- Page 249 and 250:
Table 7 Maine Lake Northern Pike Di
- Page 251 and 252:
Pattern of Introduction and Dispers
- Page 253 and 254:
4) The model developed by Solow and
- Page 255 and 256:
Inventory of Risk Rating for Waterb
- Page 257 and 258:
(Buck's Falls and Cowyard Falls), m
- Page 259 and 260:
Prescott Pond Little Wilson Stream
- Page 261 and 262:
Summary of Ecological Risk Introduc
- Page 263 and 264:
No improvements were made over the
- Page 265 and 266:
Level 3 Management actions These ar
- Page 267 and 268:
d. Conduct habitat surveys of the P
- Page 269 and 270:
Gallagher, M., R. Dill and G. Krame
- Page 271 and 272:
Starfield, A. M. and A. L. Bleloch.
- Page 273 and 274:
Appendix A: Trapping/Sorting/Counti
- Page 275 and 276:
means to “provide safe, timely an
- Page 277 and 278:
comprise the majority of fish passi
- Page 279 and 280:
exclusion. Information from publish
- Page 281 and 282:
A series TSCF system would route al
- Page 283 and 284:
(i.e., total exclusion of the targe
- Page 285 and 286:
PRFP Page 281
- Page 287 and 288:
PRFP Page 283
- Page 289 and 290:
Appendix B Outline for Preliminary
- Page 291 and 292:
channel would carry almost 1000 cfs
- Page 293 and 294:
powerhouse), rock weir/chevron/rest
- Page 295 and 296:
PRFP Page 291
- Page 297 and 298:
PRFP Page 294
- Page 299 and 300:
PRFP Page 296
- Page 301 and 302:
populations. Although each member s
- Page 303 and 304:
Appendix K - Northern Pike Movement
- Page 305 and 306:
MAINE DEPARTMENT OF MARINE RESOURCE
- Page 307 and 308:
Table of Contents (Cont’d) LIST O
- Page 309 and 310:
2.0 DESCRIPTION OF THE STUDY AREA 2
- Page 311 and 312:
3.0 METHODS Both streams were surve
- Page 313 and 314:
4.0 RESULTS 4.1 East Branch Lake 4.
- Page 315 and 316:
elevation) difference from the crib
- Page 317 and 318:
Figure 4: Water and Channel Elevati
- Page 319 and 320:
A portion of the stream passes to t
- Page 321 and 322:
4.1.3 Wangan and Sanborn brooks are
- Page 323 and 324:
Photo 6: View Looking Northwesterly
- Page 325 and 326:
location that would prevent fish fr
- Page 327 and 328:
APPENDIX 1 SURVEY OF NATURAL BARRIE
- Page 329 and 330:
Figure A-1: Orientation of Study Si
- Page 331 and 332:
Photo A-3: View from within Sanborn
- Page 333 and 334:
Response to Comments and Suggested
- Page 335 and 336:
Response: Early mortality syndrome
- Page 337 and 338:
population can provide 97,500 alewi
- Page 339 and 340:
DMR proposes to expand the Waldobor
- Page 341 and 342:
Salmon Comment: There are advocates
- Page 343 and 344:
Table 4. Species disposition Specie
- Page 345 and 346:
Kingsbury Pond X Long Pond X Long P
- Page 347 and 348:
Halfmoon Pond X Hammond Pond X X X
- Page 349 and 350:
West Garland Pond X West Lake X X X
- Page 351 and 352:
spread of any invasive species, and
- Page 353 and 354:
Response: There are conditions when
- Page 355 and 356:
Comment: Plan often uses the terms