- Page 2:
INTRODUCCIÓN Durante los últimos
- Page 5 and 6:
CAPÍTULO V: C.A. ANDALUCÍA VOLÚM
- Page 7 and 8:
INDICE 4. Plan experimental de cult
- Page 10 and 11:
PLAN NACIONAL DE CULTIVO DE SERIOLA
- Page 12 and 13:
C.A. CATALUÑA PLAN NACIONAL DE CUL
- Page 14 and 15:
CAPÍTULO I: CULTIVO DE SERIOLA uni
- Page 16 and 17:
CAPÍTULO I: CULTIVO DE SERIOLA El
- Page 18 and 19:
CAPÍTULO I: CULTIVO DE SERIOLA 303
- Page 20 and 21:
Evaluación del crecimiento de la p
- Page 22 and 23:
Alimentación de la población de c
- Page 24 and 25:
C.A. MURCIA PLAN NACIONAL DE CULTIV
- Page 26 and 27:
CAPÍTULO I: CULTIVO DE SERIOLA Exi
- Page 28 and 29:
⇒ ⇒ ⇒ CAPÍTULO I: CULTIVO DE
- Page 30 and 31:
CAPÍTULO I: CULTIVO DE SERIOLA A l
- Page 32 and 33:
CAPÍTULO I: CULTIVO DE SERIOLA Det
- Page 34 and 35:
CAPÍTULO I: CULTIVO DE SERIOLA Ló
- Page 36:
Conclusiones: Reproducción y cría
- Page 39 and 40:
CAPÍTULO I: CULTIVO DE SERIOLA - E
- Page 41 and 42:
CAPÍTULO I: CULTIVO DE SERIOLA son
- Page 43 and 44:
CAPÍTULO I: CULTIVO DE SERIOLA - P
- Page 45 and 46:
COMENTARIOS FINALES: CAPÍTULO I: C
- Page 47 and 48:
- Evaluación de la población pres
- Page 49 and 50:
CAPÍTULO II: CAPTACIÓN DE SEMILLA
- Page 51 and 52:
CAPÍTULO II: CAPTACIÓN DE SEMILLA
- Page 53 and 54:
Metodología: Cultivo de especies s
- Page 55 and 56:
CAPÍTULO II: CAPTACIÓN DE SEMILLA
- Page 57 and 58:
CAPÍTULO II: CAPTACIÓN DE SEMILLA
- Page 59 and 60:
CAPÍTULO II: CAPTACIÓN DE SEMILLA
- Page 62 and 63:
LOCALIZACIÓN DE LA EXPERIENCIA. CA
- Page 64:
CAPÍTULO II: CAPTACIÓN DE SEMILLA
- Page 67 and 68:
CAPÍTULO II: CAPTACIÓN DE SEMILLA
- Page 70 and 71:
C.A. CATALUÑA CAPÍTULO III: ABAST
- Page 72 and 73:
C.A.ASTURIAS CAPÍTULO III: ABASTEC
- Page 74 and 75:
C.A.ASTURIAS Metodología: Estudio
- Page 76 and 77:
C.A.ASTURIAS CAPÍTULO III: ABASTEC
- Page 78 and 79:
C.A.ASTURIAS Río Esva CAPÍTULO II
- Page 80:
C.A.ASTURIAS CAPÍTULO III: ABASTEC
- Page 83 and 84:
C.A.VALENCIA CAPÍTULO III: ABASTEC
- Page 85 and 86:
C.A.VALENCIA - Pérdidas de peso. B
- Page 87 and 88:
C.A.VALENCIA CAPÍTULO III: ABASTEC
- Page 90 and 91:
CAPÍTULO IV: PRODUCCIÓN DE OSTRA
- Page 92:
- Para producciones masivas. CAPÍT
- Page 95 and 96:
C.A. CATALUÑA CAPÍTULO IV: PRODUC
- Page 97 and 98:
C.A. CATALUÑA Costa Brava: Bahía
- Page 99 and 100:
C.A. CATALUÑA Costa Brava: Costa
- Page 101 and 102:
C.A. CATALUÑA Maresme. CAPÍTULO
- Page 103 and 104:
C.A. CATALUÑA Metodología: Seguim
- Page 105 and 106:
C.A. CATALUÑA CAPÍTULO IV: PRODUC
- Page 107 and 108:
C.A. CATALUÑA CAPÍTULO IV: PRODUC
- Page 109 and 110:
C.A. CATALUÑA Conclusiones: Patolo
- Page 111 and 112:
C.A. MURCIA Año 1989 CAPÍTULO IV:
- Page 113 and 114:
C.A. MURCIA Resultados: Estudio del
- Page 115 and 116:
C.A. MURCIA Metodología: Estudio d
- Page 117 and 118:
C.A. MURCIA Conclusiones: Estudio d
- Page 120 and 121:
C.A. VALENCIA CAPÍTULO IV: PRODUCC
- Page 122 and 123:
C.A. VALENCIA Para ello, es necesar
- Page 124:
COMENTARIOS FINALES: CAPÍTULO IV:
- Page 127 and 128:
Ciclo de preengorde MONOCULTIVO SEM
- Page 129 and 130:
MONOCULTIVO SEMIINTENSIVO DE LENGUA
- Page 131 and 132:
FORMACIÓN BANCO REPRODUCTORES DE H
- Page 133 and 134:
FORMACIÓN BANCO REPRODUCTORES DE H
- Page 135 and 136:
VIABILIDAD DEL CULTIVO DE VIEIRA EN
- Page 137 and 138:
Ciclo de reservas: VIABILIDAD DEL C
- Page 139 and 140:
Efecto del ciclo reproductor en el
- Page 141 and 142:
VIABILIDAD DEL CULTIVO DE VIEIRA EN
- Page 143 and 144:
Conclusiones. Obtención de la semi
- Page 145 and 146:
VIABILIDAD DEL CULTIVO DE VIEIRA EN
- Page 147 and 148:
PROCESO PRODUCTIVO DE MERO Y PARGO
- Page 149 and 150:
Análisis bioquímicos PROCESO PROD
- Page 151 and 152:
VIABILIDAD DEL CULTIVO EN ESTEROS C
- Page 153 and 154:
Conclusiones: VIABILIDAD DEL CULTIV
- Page 155 and 156:
MAPA ZOOSANITARIO DE PATOLOGÍAS DE
- Page 157 and 158:
CAPÍTULO V: C.A. ANDALUCÍA 7. PRO
- Page 159 and 160:
CAPÍTULO V: C.A. ANDALUCÍA A part
- Page 161 and 162:
CAPÍTULO V: C.A. ANDALUCÍA La lon
- Page 163 and 164:
CAPÍTULO V: C.A. ANDALUCÍA Despu
- Page 165 and 166:
Resultados: CAPÍTULO V: C.A. ANDAL
- Page 167 and 168:
DIFUSIÓN; PUBLICACIONES DEL PLAN.
- Page 169 and 170:
1. Obtención de datos económico -
- Page 171 and 172:
Conclusiones: Análisis de balances
- Page 173 and 174:
MÉTODO DE DIAGNÓSTICO MOLECULAR P
- Page 175 and 176:
COMENTARIOS FINALES. MÉTODO DE DIA
- Page 177 and 178:
CAPÍTULO V: C.A. ANDALUCÍA RESUME
- Page 179 and 180:
pH: CAPÍTULO V: C.A. ANDALUCÍA El
- Page 181 and 182:
Conclusiones: CAPÍTULO V: C.A. AND
- Page 183 and 184:
CAPÍTULO V: C.A. ANDALUCÍA 11. PR
- Page 185 and 186:
CAPÍTULO V: C.A. ANDALUCÍA 12. PR
- Page 187 and 188:
CAPÍTULO V: C.A. ANDALUCÍA - En c
- Page 189 and 190:
CAPÍTULO V: C.A. ANDALUCÍA Las ex
- Page 191 and 192:
ENSAYO DE DETOXIFICACIÓN DE MOLUSC
- Page 193 and 194:
CAPÍTULO V: C.A. ANDALUCÍA 14. PR
- Page 195 and 196:
CAPÍTULO V: C.A. ANDALUCÍA Los co
- Page 197 and 198:
CAPÍTULO V: C.A. ANDALUCÍA Los an
- Page 199 and 200:
CAPÍTULO V: C.A. ANDALUCÍA 15. PR
- Page 201 and 202:
Cultivo larvario CAPÍTULO V: C.A.
- Page 203 and 204:
CAPÍTULO V: C.A. ANDALUCÍA - A pa
- Page 205 and 206:
CULTIVO DE CORVINA CAPÍTULO V: C.A
- Page 207 and 208:
CULTIVO DE CORVINA CAPÍTULO V: C.A
- Page 209 and 210:
DOMESTICACIÓN DE LA HURTA. CRECIMI
- Page 211 and 212:
DOMESTICACIÓN DE LA HURTA. CRECIMI
- Page 213 and 214:
MEJORAS PRÁCTICAS EN EL PREENGORDE
- Page 215 and 216:
MEJORAS PRÁCTICAS EN EL PREENGORDE
- Page 217 and 218:
OTROS ESTUDIOS REALIZADOS. Comunida
- Page 219 and 220:
CAPÍTULO V: C.A. ANDALUCÍA RESUME
- Page 221 and 222:
CAPÍTULO V: C.A. ANDALUCÍA Al ana
- Page 223 and 224:
CAPÍTULO V: C.A. ANDALUCÍA - Se h
- Page 225 and 226:
CULTIVO DEL DÁTIL DE MAR CAPÍTULO
- Page 227 and 228:
Resultados obtenidos en la campaña
- Page 229 and 230:
Cría larvaria. CULTIVO DEL DÁTIL
- Page 231 and 232:
UBICACIÓN DEL PROYECTO: CULTIVO DE
- Page 233 and 234:
CULTIVO DEL DENTÓN CAPÍTULO VI: C
- Page 235 and 236:
CULTIVO DEL DENTÓN - Lote 1 (Piens
- Page 237 and 238:
Conclusiones de ambas campañas: CU
- Page 239 and 240:
DENTÓN: REPRODUCCIÓN, MEJORA DEL
- Page 241 and 242:
DENTÓN: REPRODUCCIÓN, MEJORA DEL
- Page 243 and 244:
DENTÓN: REPRODUCCIÓN, MEJORA DEL
- Page 245 and 246:
Experiencias de preengorde. DENTÓN
- Page 247 and 248:
COMENTARIOS FINALES. DENTÓN: REPRO
- Page 249 and 250:
CULTIVO DEL DENTÓN: CANIBALISMO. C
- Page 251 and 252:
OTROS ESTUDIOS REALIZADOS. Comunida
- Page 253 and 254:
Resultados: Las muestras obtenidas
- Page 255 and 256:
MEJORAS PRÁCTICAS EN EL PREENGORDE
- Page 257 and 258:
MEJORAS PRÁCTICAS EN EL PREENGORDE
- Page 259 and 260:
OTROS ESTUDIOS REALIZADOS. Comunida
- Page 261 and 262:
UBICACIÓN DEL PROYECTO: CULTIVO DE
- Page 264 and 265:
CAPÍTULO VII: C.A. CANARIAS RENDIM
- Page 266 and 267:
Resultados. Rendimiento del sistema
- Page 268 and 269:
OTROS ESTUDIOS REALIZADOS. Comunida
- Page 270 and 271:
DATOS DE LA INSTITUCIÓN: REPRODUCC
- Page 272 and 273:
REPRODUCCIÓN Y CULTIVO LARVARIO BO
- Page 274 and 275:
REPRODUCCIÓN Y CULTIVO LARVARIO BO
- Page 276 and 277:
CAPÍTULO VII: C.A. CANARIAS Dieta
- Page 278 and 279:
CAPÍTULO VII: C.A. CANARIAS Para d
- Page 280 and 281:
CAPÍTULO VII: C.A. CANARIAS Metodo
- Page 282 and 283:
DIFUSIÓN; PUBLICACIONES DEL PLAN.
- Page 284 and 285:
Organismo: Consejería de Educació
- Page 286 and 287:
Resultados: Óptima relación Prote
- Page 288 and 289:
Resultados: Fuente alternativa de p
- Page 290 and 291:
ESTUDIO DE LA FASE DE ENGORDE DEL B
- Page 292 and 293:
CAPÍTULO VII: C.A. CANARIAS 5. PRO
- Page 294 and 295:
- Cultivo de fragmentos de talos. C
- Page 296 and 297:
CAPÍTULO VII: C.A. CANARIAS Para e
- Page 298 and 299:
Cultivos experimentales de G. doryp
- Page 300 and 301:
Calidad de Grateloupia doryphora Po
- Page 302 and 303:
Características organolépticas CA
- Page 304 and 305:
COMENTARIOS FINALES. CAPÍTULO VII:
- Page 306 and 307:
CAPÍTULO VII: C.A. CANARIAS El lot
- Page 308 and 309:
CAPÍTULO VII: C.A. CANARIAS Tenien
- Page 310 and 311:
ESTUDIO COMPARATIVO DEL ENGORDE DE
- Page 312 and 313:
CAPÍTULO VIII: C.A. CANTABRIA CAP
- Page 314 and 315:
CAPÍTULO VIII: C.A. CANTABRIA Tras
- Page 316 and 317:
Siendo: Cb: Contenido basal en el p
- Page 318 and 319:
CAPÍTULO VIII: C.A. CANTABRIA El a
- Page 320 and 321:
CAPÍTULO IX: C.A. CATALUÑA ESTUDI
- Page 322 and 323:
ESTUDIO DE LA BIOLOGÍA DEL MERO Y
- Page 324 and 325:
Resultados y conclusiones 1993 (Sec
- Page 326 and 327:
Conclusiones: ESTUDIO DE LA BIOLOG
- Page 328 and 329:
ENGORDE DE EQUINODERMOS: ERIZOS DE
- Page 330 and 331:
ENGORDE DE EQUINODERMOS: ERIZOS DE
- Page 332 and 333:
- Época de retirada: ENGORDE DE EQ
- Page 334 and 335:
OTROS ESTUDIOS REALIZADOS. Comunida
- Page 336 and 337:
- 1.083 individuos de Chlamys operc
- Page 338 and 339:
CULTIVO DE DENTÓN EN JAULA FLOTANT
- Page 340 and 341:
ADAPTACIÓN A LA CAUTIVIDAD Y REPRO
- Page 342 and 343:
ADAPTACIÓN A LA CAUTIVIDAD Y REPRO
- Page 344 and 345:
CRÍA EXPERIMENTAL DE PULPO HASTA T
- Page 346 and 347:
CRÍA EXPERIMENTAL DE PULPO HASTA T
- Page 348 and 349:
MAPA ZOOSANITARIO DE PERKINSUS SP.
- Page 350 and 351:
MAPA ZOOSANITARIO DE PERKINSUS SP.
- Page 352 and 353:
CULTIVO LARVARIO Y JUVENIL DEL PULP
- Page 354 and 355:
CULTIVO LARVARIO Y JUVENIL DEL PULP
- Page 356 and 357:
CULTIVO LARVARIO Y JUVENIL DEL PULP
- Page 358 and 359:
PRESENCIA DE BONAMIA OSTREAE Y MART
- Page 360 and 361:
PRESENCIA DE BONAMIA OSTREAE Y MART
- Page 362 and 363:
PLAN INTEGRAL DEL CULTIVO DE DENTÓ
- Page 364 and 365:
Conclusiones: PLAN INTEGRAL DEL CUL
- Page 366 and 367:
CAPÍTULO IX: C.A. CATALUÑA 11. PR
- Page 368 and 369:
CAPÍTULO IX: C.A. CATALUÑA Conclu
- Page 370 and 371:
CAPÍTULO IX: C.A. CATALUÑA En tod
- Page 372 and 373:
CULTIVO INTEGRAL DEL PULPO DE ROCA:
- Page 374 and 375:
- Cultivo MC2. CULTIVO INTEGRAL DEL
- Page 376 and 377:
CULTIVO INTEGRAL DEL PULPO DE ROCA:
- Page 378 and 379:
CAPÍTULO X: C.A. GALICIA CULTIVO E
- Page 380 and 381:
CULTIVO ERIZO DE MAR EN LABORATORIO
- Page 382 and 383:
CULTIVO ERIZO DE MAR EN LABORATORIO
- Page 384 and 385:
DESARROLLO DE LÍNEAS DE ESTUDIO SO
- Page 386 and 387:
DESARROLLO DE LÍNEAS DE ESTUDIO SO
- Page 388 and 389:
DESARROLLO DE LÍNEAS DE ESTUDIO SO
- Page 390 and 391:
VIABILIDAD DEL CULTIVO DE UNDARIA P
- Page 392 and 393:
Inicio y mantenimiento del free-liv
- Page 394 and 395:
Inseminación de las unidades de cu
- Page 396 and 397:
VIABILIDAD DEL CULTIVO DE UNDARIA P
- Page 398 and 399:
VIABILIDAD DEL CULTIVO DE UNDARIA P
- Page 400 and 401:
CAPÍTULO X: C.A. GALICIA 4. PROYEC
- Page 402 and 403:
CAPÍTULO X: C.A. GALICIA En 1997 l
- Page 404 and 405:
CAPÍTULO X: C.A. GALICIA 5. PROYEC
- Page 406 and 407:
Rapetiña a pie (Vilaxoán) CAPÍTU
- Page 408 and 409:
Conclusiones; Sistema de aspiració
- Page 410 and 411:
Resultados; Ensayos en laboratorio:
- Page 412 and 413:
INDUCCIÓN A PUESTA Y CULTIVO DE SE
- Page 414 and 415:
Índice Gonadal INDUCCIÓN A PUESTA
- Page 416 and 417:
Índice Gonadal INDUCCIÓN A PUESTA
- Page 418 and 419:
OTROS ESTUDIOS REALIZADOS. Comunida
- Page 420 and 421:
OPTIMIZACIÓN DEL CULTIVO SOBREELEV
- Page 422 and 423:
OPTIMIZACIÓN DEL CULTIVO SOBREELEV
- Page 424 and 425:
SISTEMAS FLOTANTES DE CAPTACIÓN DE
- Page 426 and 427:
COMENTARIOS FINALES. SISTEMAS FLOTA
- Page 428 and 429:
CAPÍTULO X: C.A. GALICIA RESUMEN D
- Page 430 and 431:
Efectos en el gasterópodo Nucella
- Page 432 and 433:
Niveles en sedimentos. CAPÍTULO X:
- Page 434 and 435:
EMPLEO DE MICROCAPSULAS EN LA ALIME
- Page 436 and 437:
EMPLEO DE MICROCAPSULAS EN LA ALIME
- Page 438 and 439:
DIFUSIÓN; PUBLICACIONES DEL PLAN.
- Page 440 and 441:
CAPÍTULO X: C.A. GALICIA Estos 270
- Page 442 and 443:
Conclusiones: CAPÍTULO X: C.A. GAL
- Page 444 and 445:
UBICACIÓN DEL PROYECTO: CAPÍTULO
- Page 446 and 447:
CAPÍTULO X: C.A. GALICIA La máxim
- Page 448 and 449:
CAPÍTULO X: C.A. GALICIA El diseñ
- Page 450 and 451:
CAPÍTULO X: C.A. GALICIA Durante f
- Page 452 and 453:
CAPÍTULO X: C.A. GALICIA 13. PROYE
- Page 454 and 455:
CAPÍTULO X: C.A. GALICIA Figura 1.
- Page 456 and 457:
CAPÍTULO X: C.A. GALICIA Para mejo
- Page 458 and 459:
CAPÍTULO X: C.A. GALICIA Para este
- Page 460 and 461:
Figura 5. Solubilidad en agua purif
- Page 462 and 463:
CAPÍTULO X: C.A. GALICIA Tabla 1.
- Page 464 and 465:
CAPÍTULO X: C.A. GALICIA Este desf
- Page 466 and 467:
CAPÍTULO X: C.A. GALICIA Figura 11
- Page 468 and 469:
CULTIVO Y PRODUCCIÓN DE SOLÉNIDOS
- Page 470 and 471:
CULTIVO Y PRODUCCIÓN DE SOLÉNIDOS
- Page 472 and 473:
CULTIVO Y PRODUCCIÓN DE SOLÉNIDOS
- Page 474 and 475:
Estudio de crecimiento de la navaja
- Page 476 and 477:
CAPÍTULO XI: C.A. MURCIA INFLUENCI
- Page 478 and 479:
INFLUENCIA DE LA REPRODUCCIÓN EN C
- Page 480 and 481:
INFLUENCIA DE LA REPRODUCCIÓN EN C
- Page 482 and 483:
CULTIVO INTEGRAL DEL SARGO PICUDO.
- Page 484 and 485:
- Índice de eficacia alimentaria (
- Page 486 and 487:
CULTIVO INTEGRAL DEL SARGO PICUDO.
- Page 488 and 489:
Metodología: Determinación de la
- Page 490 and 491:
CULTIVO INTEGRAL DEL SARGO PICUDO.
- Page 492 and 493:
CULTIVO INTEGRAL DEL SARGO PICUDO.
- Page 494 and 495:
CULTIVO INTEGRAL DEL SARGO PICUDO.
- Page 496 and 497:
CULTIVO INTEGRAL DEL SARGO PICUDO.
- Page 498 and 499:
CULTIVO INTEGRAL DEL SARGO PICUDO.
- Page 500 and 501:
CULTIVO INTEGRAL DEL SARGO PICUDO.
- Page 502 and 503:
CULTIVO INTEGRAL DEL SARGO PICUDO.
- Page 504 and 505:
CULTIVO INTEGRAL DEL SARGO PICUDO.
- Page 506 and 507:
CULTIVO INTEGRAL DEL SARGO PICUDO.
- Page 508 and 509:
CULTIVO INTEGRAL DEL SARGO PICUDO.
- Page 510 and 511:
CULTIVO INTEGRAL DEL SARGO PICUDO.
- Page 512 and 513:
a- Incrementos de temperatura incre
- Page 514 and 515:
CULTIVO INTEGRAL DEL SARGO PICUDO.
- Page 516 and 517:
CULTIVO INTEGRAL DEL SARGO PICUDO.
- Page 518 and 519:
CULTIVO INTEGRAL DEL SARGO PICUDO.
- Page 520 and 521:
CULTIVO INTEGRAL DEL SARGO PICUDO.
- Page 522 and 523: CULTIVO INTEGRAL DEL SARGO PICUDO.
- Page 524 and 525: N (% numérico) CULTIVO INTEGRAL DE
- Page 526 and 527: CULTIVO INTEGRAL DEL SARGO PICUDO.
- Page 528 and 529: Pienso comercial CULTIVO INTEGRAL D
- Page 530 and 531: CULTIVO INTEGRAL DEL SARGO PICUDO.
- Page 532 and 533: CULTIVO INTEGRAL DEL SARGO PICUDO.
- Page 534 and 535: CULTIVO INTEGRAL DEL SARGO PICUDO.
- Page 536 and 537: CULTIVO INTEGRAL DEL SARGO PICUDO.
- Page 538 and 539: CULTIVO INTEGRAL DEL SARGO PICUDO.
- Page 540 and 541: CAPÍTULO XI: C.A. MURCIA 5. PROYEC
- Page 542 and 543: CAPÍTULO XI: C.A. MURCIA Los nivel
- Page 544 and 545: Donde: - FPL: Tamaño medio del pen
- Page 546 and 547: ENGRASE DEL ATÚN ROJO CAPÍTULO XI
- Page 548 and 549: ENGRASE DEL ATÚN ROJO CAPÍTULO XI
- Page 550 and 551: CULTIVO INTEGRAL DEL PULPO DE ROCA
- Page 552 and 553: CULTIVO INTEGRAL DEL PULPO DE ROCA
- Page 554 and 555: CULTIVO INTEGRAL DEL PULPO DE ROCA
- Page 556 and 557: CULTIVO INTEGRAL DEL PULPO DE ROCA
- Page 558 and 559: CULTIVO INTEGRAL DEL PULPO DE ROCA
- Page 560 and 561: • Medidas de CO diario en respir
- Page 562 and 563: CULTIVO INTEGRAL DEL PULPO DE ROCA
- Page 564 and 565: CAPÍTULO XII: C.A. VALENCIA CAPÍT
- Page 566 and 567: CAPÍTULO XII: C.A. VALENCIA Los hu
- Page 568 and 569: Conclusiones: CAPÍTULO XII: C.A. V
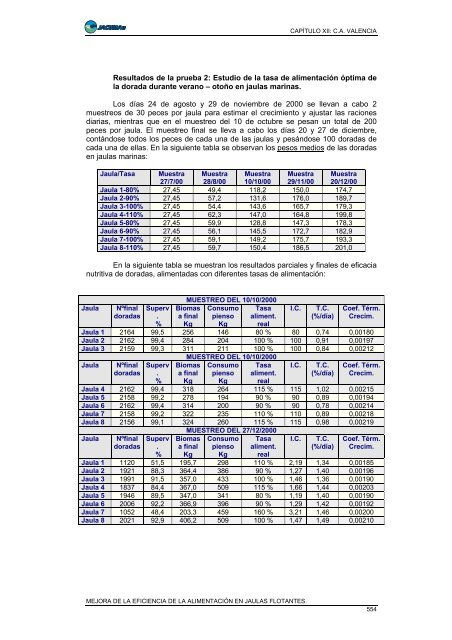
- Page 570 and 571: MEJORA DE LA EFICIENCIA DE LA ALIME
- Page 574 and 575: MEJORA DE LA EFICIENCIA DE LA ALIME
- Page 576: MEJORA DE LA EFICIENCIA DE LA ALIME