doc-0551-es
doc-0551-es
doc-0551-es

Create successful ePaper yourself
Turn your PDF publications into a flip-book with our unique Google optimized e-Paper software.
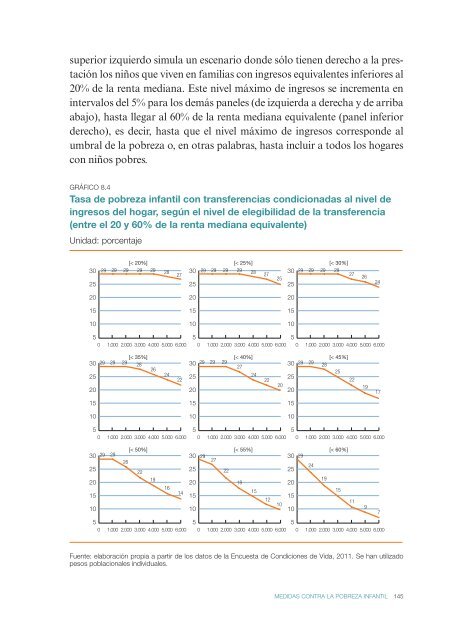
superior izquierdo simula un <strong>es</strong>cenario donde sólo tienen derecho a la pr<strong>es</strong>tación<br />
los niños que viven en familias con ingr<strong>es</strong>os equivalent<strong>es</strong> inferior<strong>es</strong> al<br />
20% de la renta mediana. Este nivel máximo de ingr<strong>es</strong>os se incrementa en<br />
intervalos del 5% para los demás panel<strong>es</strong> (de izquierda a derecha y de arriba<br />
abajo), hasta llegar al 60% de la renta mediana equivalente (panel inferior<br />
derecho), <strong>es</strong> decir, hasta que el nivel máximo de ingr<strong>es</strong>os corr<strong>es</strong>ponde al<br />
umbral de la pobreza o, en otras palabras, hasta incluir a todos los hogar<strong>es</strong><br />
con niños pobr<strong>es</strong>.<br />
Gráfico 8.4<br />
Tasa de pobreza infantil con transferencias condicionadas al nivel de<br />
ingr<strong>es</strong>os del hogar, según el nivel de elegibilidad de la transferencia<br />
(entre el 20 y 60% de la renta mediana equivalente)<br />
Unidad: porcentaje<br />
30<br />
25<br />
29 29<br />
[< 20%] [< 25%] [< 30%]<br />
29 29 29 28 30 29 29 29 29 28<br />
30 29 29 29 29<br />
27<br />
27<br />
27<br />
25<br />
25<br />
25<br />
26<br />
24<br />
20<br />
20<br />
20<br />
15<br />
15<br />
15<br />
10<br />
10<br />
10<br />
5<br />
0<br />
1.000 2.000 3.000 4.000 5.000 6.000<br />
5<br />
0<br />
1.000 2.000 3.000 4.000 5.000 6.000<br />
5<br />
0<br />
1.000 2.000 3.000 4.000 5.000 6.000<br />
[< 35%] [< 40%] [< 45%]<br />
30 29 29 29<br />
28<br />
30 29 29 29<br />
30 29 29<br />
27<br />
28<br />
26<br />
25<br />
25<br />
24 25<br />
24<br />
25<br />
22<br />
22<br />
22<br />
20<br />
20<br />
20<br />
20<br />
15<br />
15<br />
15<br />
19<br />
17<br />
10<br />
10<br />
10<br />
5<br />
0<br />
1.000 2.000 3.000 4.000 5.000 6.000<br />
5<br />
0<br />
1.000 2.000 3.000 4.000 5.000 6.000<br />
5<br />
0<br />
1.000 2.000 3.000 4.000 5.000 6.000<br />
30 29 29<br />
25<br />
20<br />
15<br />
10<br />
5<br />
0<br />
[< 50%] [< 55%] [< 60%]<br />
30 29<br />
30 29<br />
26<br />
27<br />
24<br />
25<br />
25<br />
22<br />
22<br />
19<br />
19<br />
20<br />
18<br />
20<br />
16<br />
14<br />
15<br />
15<br />
15<br />
15<br />
12<br />
11<br />
10<br />
10<br />
10<br />
1.000 2.000 3.000 4.000 5.000 6.000<br />
5<br />
0<br />
1.000 2.000 3.000 4.000 5.000 6.000<br />
5<br />
0<br />
1.000 2.000 3.000 4.000 5.000 6.000<br />
9<br />
7<br />
Fuente: elaboración propia a partir de los datos de la Encu<strong>es</strong>ta de Condicion<strong>es</strong> de Vida, 2011. Se han utilizado<br />
p<strong>es</strong>os poblacional<strong>es</strong> individual<strong>es</strong>.<br />
Medidas contra la pobreza infantil 145