- Page 1 and 2:
BANCA CARIGE SpA - Cassa di Risparm
- Page 3 and 4:
342
- Page 5 and 6:
e +25,4% nei dodici mesi) rappresen
- Page 7 and 8:
0,7% e -27,6% nei tre e nei dodici
- Page 9 and 10:
si) con un peso sul totale degli im
- Page 11 and 12:
sono costituite per la quasi totali
- Page 13 and 14:
SOFFERENZE CLIENTELA (1) - DISTRIBU
- Page 15 and 16:
VALORI NOZIONALI DEI CONTRATTI DERI
- Page 17 and 18:
I RISULTATI ECONOMICI Al 31 dicembr
- Page 19 and 20:
Le commissioni nette ammontano a 25
- Page 21 and 22:
COSTI OPERATIVI (importi in migliai
- Page 23 and 24:
PATRIMONIO NETTO POST DISTRIBUZIONE
- Page 25 and 26:
milioni, l’attività d’investim
- Page 27 and 28:
INDICATORI FINANZIARI Situazione al
- Page 29 and 30:
Signori Azionisti, la crisi, inizia
- Page 31 and 32:
STATO PATRIMONIALE ATTIVO 31/12/201
- Page 33 and 34:
CONTO ECONOMICO Voci 2011 2010 10 -
- Page 35 and 36:
Esistenze al 31/12/2010 Modifica sa
- Page 37 and 38:
RENDICONTO FINANZIARIO RENDICONTO F
- Page 39 and 40:
378
- Page 41 and 42:
- Continuità aziendale. Il bilanci
- Page 43 and 44:
Nel maggio 2011 lo IASB ha pubblica
- Page 45 and 46:
2. ATTIVITÀ FINANZIARIE DISPONIBIL
- Page 47 and 48:
- i crediti deteriorati (non perfor
- Page 49 and 50:
Se esiste una di tali condizioni vi
- Page 51 and 52:
prese le obbligazioni in circolazio
- Page 53 and 54:
condizioni in base ai quali sono st
- Page 55 and 56:
- non vi sono almeno due contributo
- Page 57 and 58:
- della riduzione del conto titoli
- Page 59 and 60:
A.3.1.4 Tasso di interesse effettiv
- Page 61 and 62:
400
- Page 63 and 64:
SEZIONE 2 ATTIVITÀ FINANZIARIE DET
- Page 65 and 66:
La composizione della voce 3. "Quot
- Page 67 and 68:
4.2 Attività finanziarie disponibi
- Page 69 and 70:
4.4 Attività finanziarie disponibi
- Page 71 and 72:
SEZIONE 6 CREDITI VERSO BANCHE - VO
- Page 73 and 74:
7.3 Crediti verso clientela attivti
- Page 75 and 76:
SEZIONE 10 LE PARTECIPAZIONI - VOCE
- Page 77 and 78:
B. AUMENTI ACQUISTI BANCA CESARE PO
- Page 79 and 80:
SEZIONE 11 ATTIVITA’ MATERIALI -
- Page 81 and 82:
11.4 Attività materiali detenute a
- Page 83 and 84:
12.2 Attività immateriali: variazi
- Page 85 and 86:
valori in % 2012 2013 2014 ECONOMIA
- Page 87 and 88:
SEZIONE 13 LE ATTIVITA’ FISCALI E
- Page 89 and 90:
(2) La voce “Operazioni di aggreg
- Page 91 and 92:
B) una serie di modifiche ad altre
- Page 93 and 94:
SEZIONE 15 ALTRE ATTIVITA’ - VOCE
- Page 95 and 96:
SEZIONE 2 DEBITI VERSO CLIENTELA -
- Page 97 and 98:
3.2 Dettaglio della voce 30 "Titoli
- Page 99 and 100:
4.4 Passività finanziarie per cass
- Page 101 and 102:
5.3 Passività finanziarie valutate
- Page 103 and 104:
SEZIONE 8 PASSIVITA’ FISCALI - VO
- Page 105 and 106:
SEZIONE 11 TRATTAMENTO DI FINE RAPP
- Page 107 and 108: SEZIONE 12 FONDI PER RISCHI E ONERI
- Page 109 and 110: - il quadro normativo adottato nell
- Page 111 and 112: euro 10 milioni in termini di impos
- Page 113 and 114: SEZIONE 14 PATRIMONIO DELL’IMPRES
- Page 115 and 116: La riserva di fusione è stata cost
- Page 117 and 118: Denominazione Importo Possibilità
- Page 119 and 120: SEZIONE 15 ALTRE INFORMAZIONI 1. Ga
- Page 121 and 122: 460
- Page 123 and 124: 1.4 Interessi passivi e oneri assim
- Page 125 and 126: 2.2 Commissioni attive: canali dist
- Page 127 and 128: SEZIONE 4 IL RISULTATO NETTO DELL
- Page 129 and 130: Utili P erdite R isultato netto Uti
- Page 131 and 132: Cancellaz ioni Altre SEZIONE 8 LE R
- Page 133 and 134: SEZIONE 9 LE SPESE AMMINISTRATIVE -
- Page 135 and 136: SEZIONE 10 ACCANTONAMENTI NETTI AI
- Page 137 and 138: SEZIONE 12 RETTIFICHE/RIPRESE DI VA
- Page 139 and 140: SEZIONE 14 UTILI (PERDITE) DELLE PA
- Page 141 and 142: SEZIONE 18 LE IMPOSTE SUL REDDITO D
- Page 143 and 144: SEZIONE 19 UTILI (PERDITA) DEI GRUP
- Page 145 and 146: PROSPETTO ANALITICO DELLA REDDITIVI
- Page 147 and 148: Sofferenze Incagli Esposizioni rist
- Page 149 and 150: Esposizione lorda Rettifiche specif
- Page 151 and 152: A.1.6 Esposizioni creditizie per ca
- Page 153 and 154: A.2 CLASSIFICAZIONE DELLE ESPOSIZIO
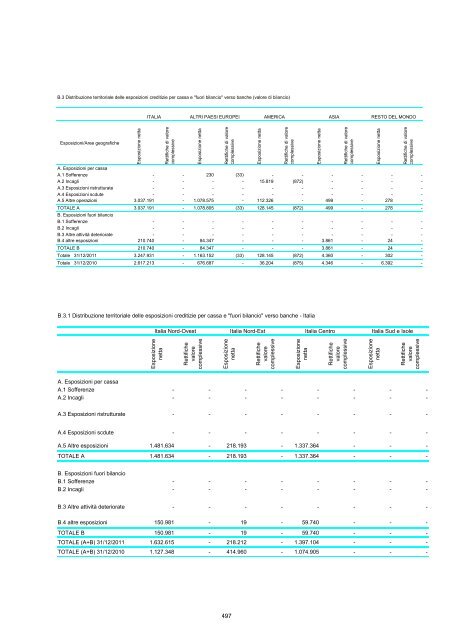
- Page 155 and 156: Valore esposizione netta Immobili T
- Page 157: Esposizione netta Rettifiche valore
- Page 161 and 162: integralmente o parzialmente, da ip
- Page 163 and 164: L’operazione di cartolarizzazione
- Page 165 and 166: Valore di bilancio Rettif./ riprese
- Page 167 and 168: C.1.6 Interessenze in società veic
- Page 169 and 170: C.3 OPERAZIONI DI COVERED BOND a) P
- Page 171 and 172: Le altre Banche cedenti percepiscon
- Page 173 and 174: In data 13 febbraio 2012 è stata e
- Page 175 and 176: Informazioni di natura quantitativa
- Page 177 and 178: 2. Portafoglio di negoziazione di v
- Page 179 and 180: C. Attività di copertura dei fluss
- Page 181 and 182: Valuta di denominazione: Dollaro Ti
- Page 183 and 184: 2.3 RISCHIO DI CAMBIO Informazioni
- Page 185 and 186: A.2 Portafoglio bancario: valori no
- Page 187 and 188: A.3 Derivati finanziari: fair value
- Page 189 and 190: Governi e Banche Centrali Altri ent
- Page 191 and 192: Governi e Banche Centrali Altri ent
- Page 193 and 194: B. DERIVATI CREDITIZI B.1 Derivati
- Page 195 and 196: Governi e Banche Centrali Altri ent
- Page 197 and 198: Valuta di denominazione: Dollaro US
- Page 199 and 200: 538
- Page 201 and 202: B. Informazioni di natura quantitat
- Page 203 and 204: SEZIONE 2 - IL PATRIMONIO E I COEFF
- Page 205 and 206: corresponsione degli interessi deve
- Page 207 and 208: 31/12/2011 31/12/2010 A. Patrimonio
- Page 209 and 210:
548
- Page 211 and 212:
550
- Page 213 and 214:
Rientrano nelle altre parti correla
- Page 215 and 216:
A. Informazioni di natura qualitati
- Page 217 and 218:
L’informativa sui settori di atti
- Page 219 and 220:
558
- Page 221 and 222:
PROPOSTA DI APPROVAZIONE DEL BILANC
- Page 223 and 224:
Relazione del Collegio Sindacale de
- Page 225 and 226:
Collegio Sindacale 68 volte. * * *
- Page 227 and 228:
Cassa di Risparmio di Savona S.p.A.
- Page 229 and 230:
diritti degli azionisti di società
- Page 231 and 232:
controllata Creditis Servizi Finanz
- Page 233 and 234:
versamento di un’imposta sostitut
- Page 235 and 236:
19. in relazione a quanto precede i
- Page 237 and 238:
Peraltro nella Relazione sulla Gest
- Page 239 and 240:
esigenze dell’impresa e che i pre
- Page 241 and 242:
Antiriciclaggio), il ruolo di regia
- Page 243 and 244:
svolge altresì attività di Manage
- Page 245 and 246:
Il Collegio Sindacale ritiene, quin
- Page 247 and 248:
In particolare la relazione della S
- Page 249 and 250:
stata valutata nel bilancio al 31 d
- Page 251 and 252:
covered bond, alla cessione di atti
- Page 253 and 254:
E’ stata verificata l’osservanz
- Page 255 and 256:
Conto Economico (in euro) margine d
- Page 257 and 258:
Dafne Immobiliare S.r.l., I.H. Roma
- Page 259 and 260:
598
- Page 261 and 262:
600
- Page 263 and 264:
Informazioni ai sensi dell’art. 1
- Page 265 and 266:
Società partecipata Stato di Perce
- Page 267 and 268:
DATI DI SINTESI DELLE IMPRESE CONTR
- Page 269 and 270:
DATI DI SINTESI DELLE IMPRESE SOTTO
- Page 271 and 272:
RIVALUTAZIONI MONETARIE SUL PATRIMO
- Page 273 and 274:
Sup. Valore F.do amm.to Valore a mq
- Page 275 and 276:
Sup. Valore F.do amm.to Valore a mq
- Page 277 and 278:
Sup. Valore F.do amm.to Valore a mq
- Page 279 and 280:
Altri immobili a) Fondo integrazion
- Page 281 and 282:
Sup. Valore F.do amm.to Valore a mq
- Page 283 and 284:
B Back office La struttura di una s
- Page 285 and 286:
premi, unici o periodici, che sono
- Page 287 and 288:
Equity origination Incremento del c
- Page 289 and 290:
L L.A.T. - Liability Adequacy Test
- Page 291 and 292:
d) le azioni o quote in banche, soc
- Page 293 and 294:
Shifted Beta Gap Metodologia di gap
- Page 295 and 296:
Elenco dei principi contabili IAS/I
- Page 297:
2) Interpretazioni (SIC/IFRIC) SIC/