- Page 1 and 2: THE IMPACT OF URBAN GROUNDWATER UPO
- Page 3 and 4: ABSTRACT A field-based research stu
- Page 5 and 6: ACKNOWLEDGEMENTS I would like to th
- Page 7 and 8: 3.4.1 Solid Geology ...............
- Page 9 and 10: 5.5.2 Riverbed Sediment Core Data a
- Page 11 and 12: 6.10 Investigation of groundwater-s
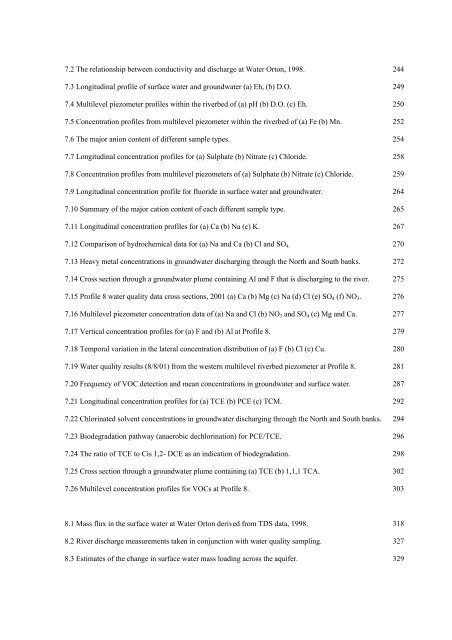
- Page 13 and 14: LIST OF FIGURES 2.1 Conceptual mode
- Page 15: 6.1 Schematic diagram for the analy
- Page 19 and 20: APPENDICES Appendices 1, 11, 19, 20
- Page 21 and 22: 1.1 Project outline CHAPTER 1. INTR
- Page 23 and 24: 4) to develop suitable monitoring m
- Page 25 and 26: INTRODUCTION European Commission Wa
- Page 27 and 28: REVIEW 2.1) and surface water may o
- Page 29 and 30: REVIEW features of groundwater/surf
- Page 31 and 32: REVIEW provide refuge to benthic in
- Page 33 and 34: Abstraction For drinking water supp
- Page 35 and 36: REVIEW occur such as biodegradation
- Page 37 and 38: 2.2.1 Water quality studies REVIEW
- Page 39 and 40: REVIEW investigated groundwater/sur
- Page 41 and 42: REVIEW owing to their widespread de
- Page 43 and 44: REVIEW have been used to determine
- Page 45 and 46: REVIEW and under conditions of non-
- Page 47 and 48: (b) (a) River Tame 10 m topographic
- Page 49 and 50: STUDY SETTING But under the General
- Page 51 and 52: (a) Land Use In The River Tame Corr
- Page 53 and 54: (a) (b) Figure 3.3 (a) Photograph o
- Page 55 and 56: Figure 3.4 Schematic geology of the
- Page 57 and 58: Table 3.1 Description of geological
- Page 59 and 60: Wildmoor Sandstone Formation (middl
- Page 61 and 62: STUDY SETTING Man-made excavations
- Page 63 and 64: STUDY SETTING Tame were effluent to
- Page 65 and 66: (a) (b) (c) Figure 3.9 (a) Postulat
- Page 67 and 68:
STUDY SETTING this restricts the le
- Page 69 and 70:
Figure 3.10 Schematic cross section
- Page 71 and 72:
STUDY SETTING water quality through
- Page 73 and 74:
STUDY SETTING (Ford, 1990) from nin
- Page 75 and 76:
STUDY SETTING dry cleaning industry
- Page 77 and 78:
MONITORING NETWORKS AND METHODS CHA
- Page 79 and 80:
2 9 4 0 0 0 2 8 8 0 0 0 4020000 410
- Page 81 and 82:
MONITORING NETWORKS AND METHODS The
- Page 83 and 84:
Water quality data were collected i
- Page 85 and 86:
MONITORING NETWORKS AND METHODS pie
- Page 87 and 88:
MONITORING NETWORKS AND METHODS The
- Page 89 and 90:
MONITORING NETWORKS AND METHODS The
- Page 91 and 92:
MONITORING NETWORKS AND METHODS pre
- Page 93 and 94:
MONITORING NETWORKS AND METHODS the
- Page 95 and 96:
MONITORING NETWORKS AND METHODS (Ga
- Page 97 and 98:
MONITORING NETWORKS AND METHODS Acc
- Page 99 and 100:
MONITORING NETWORKS AND METHODS bor
- Page 101 and 102:
MONITORING NETWORKS AND METHODS tha
- Page 103 and 104:
MONITORING NETWORKS AND METHODS des
- Page 105 and 106:
4.7.3 Grain size analyses by the Ha
- Page 107 and 108:
K = hydraulic conductivity (feet da
- Page 109 and 110:
MONITORING NETWORKS AND METHODS A s
- Page 111 and 112:
MONITORING NETWORKS AND METHODS The
- Page 113 and 114:
MONITORING NETWORKS AND METHODS Run
- Page 115 and 116:
MONITORING NETWORKS AND METHODS nex
- Page 117 and 118:
MONITORING NETWORKS AND METHODS The
- Page 119 and 120:
MONITORING NETWORKS AND METHODS Dif
- Page 121 and 122:
4.9.3 Radial Flow Analytical Soluti
- Page 123 and 124:
q = - k dh dx River Riverbed q = th
- Page 125 and 126:
Determinands Method of analyses Ana
- Page 127 and 128:
MONITORING NETWORKS AND METHODS dif
- Page 129 and 130:
5.2 Groundwater in the Tame Valley
- Page 131 and 132:
Total Monthly Volume Abstracted (m
- Page 133 and 134:
4020000 4100000 Bescot GS 91, 182 1
- Page 135 and 136:
5.3.2 Baseflow Analyses GROUNDWATER
- Page 137 and 138:
GROUNDWATER FLOW TO THE RIVER TAME
- Page 139 and 140:
GROUNDWATER FLOW TO THE RIVER TAME
- Page 141 and 142:
GROUNDWATER FLOW TO THE RIVER TAME
- Page 143 and 144:
GROUNDWATER FLOW TO THE RIVER TAME
- Page 145 and 146:
GROUNDWATER FLOW TO THE RIVER TAME
- Page 147 and 148:
Temperature C o 20 19.5 19 18.5 18
- Page 149 and 150:
GROUNDWATER FLOW TO THE RIVER TAME
- Page 151 and 152:
5 cm Figure 5.16 (a) Riverbed core
- Page 153 and 154:
Frequency 9 8 7 6 5 4 3 2 1 0 10 20
- Page 155 and 156:
Summary of Darcy Specific Discharge
- Page 157 and 158:
GROUNDWATER FLOW TO THE RIVER TAME
- Page 159 and 160:
Location Specific Discharge (md -1
- Page 161 and 162:
GROUNDWATER FLOW TO THE RIVER TAME
- Page 163 and 164:
5.8 The Hydrogeological Setting of
- Page 165 and 166:
Level ( m.a.o.d ) Level ( m.a.o.d )
- Page 167 and 168:
5.9 Concluding Discussion GROUNDWAT
- Page 169 and 170:
GROUNDWATER FLOW TO THE RIVER TAME
- Page 171 and 172:
CHAPTER 6. THE MODELLING OF GROUNDW
- Page 173 and 174:
6.2.1 Analytical Model, Steady Stat
- Page 175 and 176:
GROUNDWATER FLOW MODELLING The rive
- Page 177 and 178:
GROUNDWATER FLOW MODELLING 6.3.1 Re
- Page 179 and 180:
39 57 Figure 6.2 Regional Setting f
- Page 181 and 182:
GROUNDWATER FLOW MODELLING increase
- Page 183 and 184:
GROUNDWATER FLOW MODELLING general,
- Page 185 and 186:
Groundwater head contours (1m) 93.0
- Page 187 and 188:
GROUNDWATER FLOW MODELLING 6.4.3 Gr
- Page 189 and 190:
11 12 13 # # # # # # 96 97 98 Colum
- Page 191 and 192:
GROUNDWATER FLOW MODELLING unsatura
- Page 193 and 194:
River level data GROUNDWATER FLOW M
- Page 195 and 196:
GROUNDWATER FLOW MODELLING of geolo
- Page 197 and 198:
GROUNDWATER FLOW MODELLING The FAT3
- Page 199 and 200:
GROUNDWATER FLOW MODELLING and grav
- Page 201 and 202:
Elevation of cell centre (m.a.o.d)
- Page 203 and 204:
GROUNDWATER FLOW MODELLING transmis
- Page 205 and 206:
GROUNDWATER FLOW MODELLING on each
- Page 207 and 208:
GROUNDWATER FLOW MODELLING The FAT3
- Page 209 and 210:
GROUNDWATER FLOW MODELLING of 0.5md
- Page 211 and 212:
Analytical solution for the saturat
- Page 213 and 214:
GROUNDWATER FLOW MODELLING presence
- Page 215 and 216:
GROUNDWATER FLOW MODELLING in secti
- Page 217 and 218:
GROUNDWATER FLOW MODELLING The FAT3
- Page 219 and 220:
GROUNDWATER FLOW MODELLING The aver
- Page 221 and 222:
GROUNDWATER FLOW MODELLING would re
- Page 223 and 224:
GROUNDWATER FLOW MODELLING the aqui
- Page 225 and 226:
95 95 95 95 39 MODFLOW Particle Tra
- Page 227 and 228:
GROUNDWATER FLOW MODELLING Historic
- Page 229 and 230:
Discharge to the river m 3 d -1 % v
- Page 231 and 232:
GROUNDWATER FLOW MODELLING 6.10.2 A
- Page 233 and 234:
GROUNDWATER FLOW MODELLING investig
- Page 235 and 236:
GROUNDWATER FLOW MODELLING across t
- Page 237 and 238:
GROUNDWATER FLOW MODELLING by the F
- Page 239 and 240:
Specific discharge to the river fro
- Page 241 and 242:
GROUNDWATER FLOW MODELLING in time
- Page 243 and 244:
GROUNDWATER FLOW MODELLING unsatura
- Page 245 and 246:
GROUNDWATER FLOW MODELLING amplitud
- Page 247 and 248:
Depth (cm) -80 -100 -120 -140 -160
- Page 249 and 250:
Depth (cm) -40 -60 -80 -100 -120 -1
- Page 251 and 252:
GROUNDWATER FLOW MODELLING cycles o
- Page 253 and 254:
6.12 Conclusions GROUNDWATER FLOW M
- Page 255 and 256:
GROUNDWATER FLOW MODELLING consider
- Page 257 and 258:
WATER QUALITY INTERACTIONS CHAPTER
- Page 259 and 260:
Water Quality Data From Sutton Park
- Page 261 and 262:
WATER QUALITY INTERACTIONS 7.1 Indi
- Page 263 and 264:
WATER QUALITY INTERACTIONS (the fur
- Page 265 and 266:
WATER QUALITY INTERACTIONS Underlyi
- Page 267 and 268:
WATER QUALITY INTERACTIONS Oxygen l
- Page 269 and 270:
(a) (b) Eh (mv) DO (mgl -1 ) 600 50
- Page 271 and 272:
WATER QUALITY INTERACTIONS riverbed
- Page 273 and 274:
WATER QUALITY INTERACTIONS samples
- Page 275 and 276:
WATER QUALITY INTERACTIONS errors i
- Page 277 and 278:
WATER QUALITY INTERACTIONS industri
- Page 279 and 280:
(a) (b) (c) Depth below river bed (
- Page 281 and 282:
WATER QUALITY INTERACTIONS within 5
- Page 283 and 284:
WATER QUALITY INTERACTIONS The grea
- Page 285 and 286:
Cation Content (mgl -1 ) 300 250 20
- Page 287 and 288:
(a) (b) (c) Calcium Concentration m
- Page 289 and 290:
WATER QUALITY INTERACTIONS in the u
- Page 291 and 292:
7.5 Toxic Metals WATER QUALITY INTE
- Page 293 and 294:
WATER QUALITY INTERACTIONS parkland
- Page 295 and 296:
95 94 93 92 OD (meters) 91 90 89 88
- Page 297 and 298:
(a) (b) (c) Chloride (meql -1 ) Nit
- Page 299 and 300:
(a) (b) Depth below river bed (cm)
- Page 301 and 302:
(a) (c) (e) Depth below river bed (
- Page 303 and 304:
WATER QUALITY INTERACTIONS depth. T
- Page 305 and 306:
WATER QUALITY INTERACTIONS extent.
- Page 307 and 308:
Number of samples greater than dete
- Page 309 and 310:
WATER QUALITY INTERACTIONS The only
- Page 311 and 312:
WATER QUALITY INTERACTIONS source f
- Page 313 and 314:
WATER QUALITY INTERACTIONS The surf
- Page 315 and 316:
WATER QUALITY INTERACTIONS The Envi
- Page 317 and 318:
WATER QUALITY INTERACTIONS the bias
- Page 319 and 320:
WATER QUALITY INTERACTIONS The grou
- Page 321 and 322:
WATER QUALITY INTERACTIONS value of
- Page 323 and 324:
Depth below river bed (cm) 0 20 40
- Page 325 and 326:
WATER QUALITY INTERACTIONS There is
- Page 327 and 328:
WATER QUALITY INTERACTIONS Standard
- Page 329 and 330:
WATER QUALITY INTERACTIONS general
- Page 331 and 332:
WATER QUALITY INTERACTIONS attenuat
- Page 333 and 334:
WATER QUALITY INTERACTIONS these fa
- Page 335 and 336:
GROUNDWATER FLUX CHAPTER 8. ESTIMAT
- Page 337 and 338:
GROUNDWATER FLUX solution then the
- Page 339 and 340:
GROUNDWATER FLUX the riverbed piezo
- Page 341 and 342:
HCO3 - Determinant Mean Groundwater
- Page 343 and 344:
Residential roof run-off *1 General
- Page 345 and 346:
GROUNDWATER FLUX availability of sa
- Page 347 and 348:
Discharge MLd -1 350 330 310 290 27
- Page 349 and 350:
(a) Dissolved Mass gs -1 Dissolved
- Page 351 and 352:
GROUNDWATER FLUX exception of Si, C
- Page 353 and 354:
Location Distance from Bescot GS (k
- Page 355 and 356:
GROUNDWATER FLUX groundwater is a s
- Page 357 and 358:
Maximum concentration in the plume
- Page 359 and 360:
GROUNDWATER FLUX 150 m was used, to
- Page 361 and 362:
Estimate of mass flux from the plum
- Page 363 and 364:
GROUNDWATER FLUX an urban setting.
- Page 365 and 366:
GROUNDWATER FLUX improvement of sur
- Page 367 and 368:
CONCLUSIONS CHAPTER 9. CONCLUSIONS
- Page 369 and 370:
CONCLUSIONS surface-water quality b
- Page 371 and 372:
CONCLUSIONS 1945) which caused sign
- Page 373 and 374:
CONCLUSIONS Objective 4. To develop
- Page 375 and 376:
CONCLUSIONS On a catchment scale, g
- Page 377 and 378:
CONCLUSIONS other compounds of inte
- Page 379 and 380:
CONCLUSIONS groundwater and surface
- Page 381 and 382:
REFERENCES REFERENCES Allen, D.J.,
- Page 383 and 384:
REFERENCES Bredehoeft, J.D., & Papa
- Page 385 and 386:
REFERENCES De Marsily, G., 1986. Qu
- Page 387 and 388:
REFERENCES Ford, M., Tellam, J.H.,
- Page 389 and 390:
REFERENCES Hooda, P.S., Moynagh, M.
- Page 391 and 392:
REFERENCES Kuwabara, J., Berelson,
- Page 393 and 394:
REFERENCES Modica, E., 1993. Hydrau
- Page 395 and 396:
REFERENCES Rivett, M.O., Feenstra,
- Page 397 and 398:
REFERENCES Stagg, K.A., 2000. An in
- Page 399:
REFERENCES Younger, P.L., 1989. Str


