how do adolescents define depression? - cIRcle - University of ...
how do adolescents define depression? - cIRcle - University of ...
how do adolescents define depression? - cIRcle - University of ...
You also want an ePaper? Increase the reach of your titles
YUMPU automatically turns print PDFs into web optimized ePapers that Google loves.
Chapter IV: Results<br />
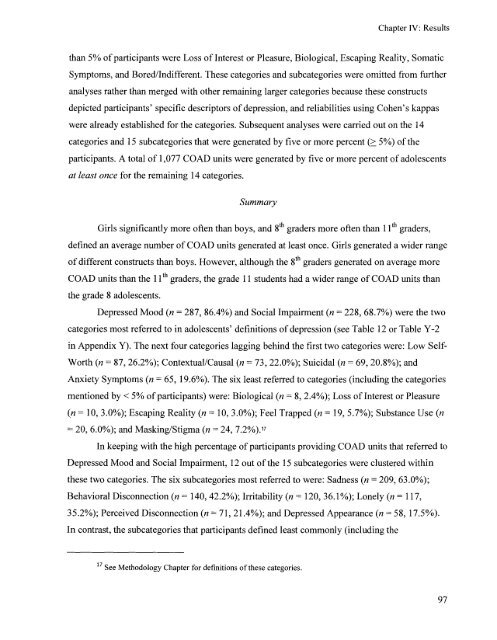
than 5% <strong>of</strong> participants were Loss <strong>of</strong> Interest or Pleasure, Biological, Escaping Reality, Somatic<br />
Symptoms, and Bored/Indifferent. These categories and subcategories were omitted from further<br />
analyses rather than merged with other remaining larger categories because these constructs<br />
depicted participants' specific descriptors <strong>of</strong> <strong>depression</strong>, and reliabilities using Cohen's kappas<br />
were already established for the categories. Subsequent analyses were carried out on the 14<br />
categories and 15 subcategories that were generated by five or more percent (> 5%) <strong>of</strong> the<br />
participants. A total <strong>of</strong> 1,077 COAD units were generated by five or more percent <strong>of</strong> a<strong>do</strong>lescents<br />
at least once for the remaining 14 categories.<br />
Summary<br />
Girls significantly more <strong>of</strong>ten than boys, and 8 th graders more <strong>of</strong>ten than 11 th graders,<br />
<strong>define</strong>d an average number <strong>of</strong> COAD units generated at least once. Girls generated a wider range<br />
<strong>of</strong> different constructs than boys. However, although the 8th graders generated on average more<br />
COAD units than the 11 th graders, the grade 11 students had a wider range <strong>of</strong> COAD units than<br />
the grade 8 a<strong>do</strong>lescents.<br />
Depressed Mood (n = 287, 86.4%) and Social Impairment (n = 228, 68.7%) were the two<br />
categories most referred to in a<strong>do</strong>lescents' definitions <strong>of</strong> <strong>depression</strong> (see Table 12 or Table Y-2<br />
in Appendix Y). The next four categories lagging behind the first two categories were: Low Self-<br />
Worth (n = 87, 26.2%); Contextual/Causal (n = 73, 22.0%); Suicidal (n = 69, 20.8%); and<br />
Anxiety Symptoms (n = 65, 19.6%). The six least referred to categories (including the categories<br />
mentioned by < 5% <strong>of</strong> participants) were: Biological (n = 8, 2.4%); Loss <strong>of</strong> Interest or Pleasure<br />
(n = 10, 3.0%); Escaping Reality (n = 10, 3.0%); Feel Trapped (n = 19, 5.7%); Substance Use (n<br />
= 20, 6.0%); and Masking/Stigma (n = 24, 7.2%). 1 7<br />
In keeping with the high percentage <strong>of</strong> participants providing COAD units that referred to<br />
Depressed Mood and Social Impairment, 12 out <strong>of</strong> the 15 subcategories were clustered within<br />
these two categories. The six subcategories most referred to were: Sadness (n = 209, 63.0%);<br />
Behavioral Disconnection (n = 140, 42.2%); Irritability (n = 120, 36.1%); Lonely (n = 117,<br />
35.2%); Perceived Disconnection (n = 71, 21.4%); and Depressed Appearance (n = 58, 17.5%).<br />
In contrast, the subcategories that participants <strong>define</strong>d least commonly (including the<br />
17 See Metho<strong>do</strong>logy Chapter for definitions <strong>of</strong> these categories.<br />
97


