- Page 1 and 2:
HOW DO ADOLESCENTS DEFINE DEPRESSIO
- Page 3 and 4:
understanding to guide future resea
- Page 5 and 6:
Introduction^ 29 Adolescents' Self-
- Page 7 and 8:
Remaining Significant Categories an
- Page 9 and 10:
APPENDIX F: Self-Recognition of Ado
- Page 11 and 12:
LIST OF TABLES Table 1 Developmenta
- Page 13 and 14: Table Al -4 Percentages and Chi-Squ
- Page 15 and 16: ACKNOWLEDGEMENTS There are many ind
- Page 17 and 18: CHAPTER I: INTRODUCTION Chapter I:
- Page 19 and 20: Chapter I: Introduction expected to
- Page 21 and 22: Chapter I: Introduction Bloom, 2001
- Page 23 and 24: Chapter II: Literature Review unspe
- Page 25 and 26: Chapter II: Literature Review This
- Page 27 and 28: Chapter II: Literature Review const
- Page 29 and 30: Chapter II: Literature Review Rutte
- Page 31 and 32: Chapter II: Literature Review throu
- Page 33 and 34: Chapter II: Literature Review et al
- Page 35 and 36: Chapter II: Literature Review exter
- Page 37 and 38: Chapter II: Literature Review Perha
- Page 39 and 40: Chapter II: Literature Review and H
- Page 41 and 42: Chapter II: Literature Review versi
- Page 43 and 44: Chapter II: Literature Review affec
- Page 45 and 46: Chapter II: Literature Review can i
- Page 47 and 48: Chapter II: Literature Review subth
- Page 49 and 50: Chapter II: Literature Review appro
- Page 51 and 52: Chapter II: Literature Review suppo
- Page 53 and 54: Chapter II: Literature Review is a
- Page 55 and 56: Chapter II: Literature Review persp
- Page 57 and 58: Chapter II: Literature Review The f
- Page 59 and 60: Chapter II: Literature Review an af
- Page 61 and 62: Emotional Competence Chapter II: Li
- Page 63: Chapter II: Literature Review Resea
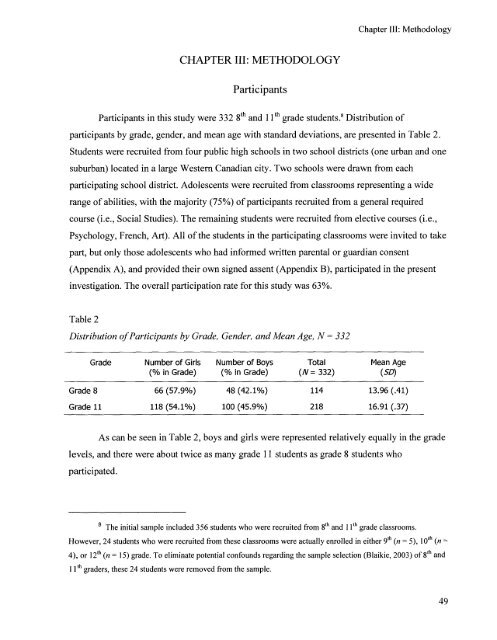
- Page 67 and 68: Chapter III: Methodology As can be
- Page 69 and 70: Chapter III: Methodology interactio
- Page 71 and 72: Emotion Regulation: Sadness Chapter
- Page 73 and 74: Chapter III: Methodology for Anger
- Page 75 and 76: Chapter III: Methodology of death (
- Page 77 and 78: Content Analysis of Participants '
- Page 79 and 80: Chapter III: Methodology using cont
- Page 81 and 82: Chapter III: Methodology Some categ
- Page 83 and 84: Chapter III: Methodology these unit
- Page 85 and 86: Chapter III: Methodology A total of
- Page 87 and 88: Table 7 Chapter III: Methodology Ca
- Page 89 and 90: Chapter III: Methodology #^Category
- Page 91 and 92: Chapter III: Methodology Category ^
- Page 93 and 94: Chapter III: Methodology to partici
- Page 95 and 96: Chapter III: Methodology pamphlets
- Page 97 and 98: CHAPTER IV: RESULTS Chapter IV: Res
- Page 99 and 100: Chapter IV: Results category and su
- Page 101 and 102: Chapter IV: Results the Methodology
- Page 103 and 104: Table 12 Chapter IV: Results Freque
- Page 105 and 106: Category/Subcategory Defined Units
- Page 107 and 108: Category/Subcategory Defined Units
- Page 109 and 110: Chapter IV: Results lower percentag
- Page 111 and 112: Chapter IV: Results COAD unit in th
- Page 113 and 114: Chapter IV: Results than 5% of part
- Page 115 and 116:
Chapter IV: Results presented in pa
- Page 117 and 118:
Chapter IV: Results Appendix Al for
- Page 119 and 120:
Table 18 Percentages, Significant a
- Page 121 and 122:
Table 19 Chapter IV: Results Percen
- Page 123 and 124:
Chapter IV: Results significant ass
- Page 125 and 126:
Chapter IV: Results variable contai
- Page 127 and 128:
Chapter IV: Results Association bet
- Page 129 and 130:
ecognition groups, generated COAD u
- Page 131 and 132:
Chapter IV: Results More than 80% o
- Page 133 and 134:
Chapter IV: Results same variables.
- Page 135 and 136:
Category / Subcategory Fatigue/Loss
- Page 137 and 138:
Chapter IV: Results Association of
- Page 139 and 140:
Chapter IV: Results were screened a
- Page 141 and 142:
Chapter 1V: Results girls (n = 67),
- Page 143 and 144:
Chapter IV: Results inhibition; wer
- Page 145 and 146:
Chapter IV: Results correlated with
- Page 147 and 148:
Chapter IV: Results model now with
- Page 149 and 150:
Hierarchical Regression Analysis fo
- Page 151 and 152:
CHAPTER V: DISCUSSION Depression: A
- Page 153 and 154:
Chapter V: Discussion depression in
- Page 155 and 156:
Chapter V: Discussion reported more
- Page 157 and 158:
Depressed Mood Chapter V: Discussio
- Page 159 and 160:
Chapter V: Discussion under Depress
- Page 161 and 162:
Chapter V: Discussion discussed in
- Page 163 and 164:
Chapter V: Discussion Biller, Ruiz,
- Page 165 and 166:
Chapter V: Discussion impossible co
- Page 167 and 168:
Association of Categories and Subca
- Page 169 and 170:
constructs reflect overt characteri
- Page 171 and 172:
Chapter V: Discussion definitions i
- Page 173 and 174:
Chapter V: Discussion Association o
- Page 175 and 176:
Chapter V: Discussion Lifetime Self
- Page 177 and 178:
Chapter V: Discussion Social Perspe
- Page 179 and 180:
Chapter V: Discussion symptomatolog
- Page 181 and 182:
Study Strengths and Limitations Stu
- Page 183 and 184:
along with their family's permissio
- Page 185 and 186:
Chapter V: Discussion sectional stu
- Page 187 and 188:
Chapter V: Discussion development,
- Page 189 and 190:
Chapter V: Discussion which include
- Page 191 and 192:
Chapter V: Discussion not wait for
- Page 193 and 194:
REFERENCES References Achenbach, T.
- Page 195 and 196:
Beck, A. T., Rush, A. J., Shaw, B.
- Page 197 and 198:
References Byrnes, J. P. (1988). Fo
- Page 199 and 200:
school adolescents: A randomized tr
- Page 201 and 202:
References Compton, S. N., Burns, B
- Page 203 and 204:
References Eisenberg, N., Fabes, R.
- Page 205 and 206:
Fombonne, E., Wostear, G., Cooper,
- Page 207 and 208:
References Glasersfeld, E. von (197
- Page 209 and 210:
Hall, G. S. (1904). Adolescence its
- Page 211 and 212:
References Jackson, S. W. (1986). M
- Page 213 and 214:
References Keating, D. P. (1988). B
- Page 215 and 216:
Kurt, M. D., & Crowley, S. L. (2002
- Page 217 and 218:
References Mechanic, D. (1978). Sex
- Page 219 and 220:
National Institute of Mental Health
- Page 221 and 222:
References Patton, G. C., Hetrick,
- Page 223 and 224:
References Reynolds, W. M. (1986a).
- Page 225 and 226:
Rutter, M., Kim-Cohen, J., & Maugha
- Page 227 and 228:
References Schultz, L. H., & Selman
- Page 229 and 230:
Southam-Gerow, M. A. & Kendall, P.
- Page 231 and 232:
References Taylor, M. (1996). A the
- Page 233 and 234:
References Wentzel, K. R. &, Erdley
- Page 235 and 236:
APPENDIX A: Parental or Guardian Co
- Page 237 and 238:
APPENDIX B: Student Assent Form UNI
- Page 239 and 240:
APPENDIX C: Demographic Information
- Page 241 and 242:
APPENDIX E: Conceptions of Adolesce
- Page 243 and 244:
APPENDIX G: Thought About Own Need
- Page 245 and 246:
Appendices APPENDIX I: Access Colum
- Page 247 and 248:
APPENDIX K: Photo Example of Sheet
- Page 249 and 250:
APPENDIX M: Intercoder Sheet With R
- Page 251 and 252:
Pilot Study APPENDIX 0: Pilot Study
- Page 253 and 254:
Appendices UBC is Dr. Kimberly Scho
- Page 255 and 256:
APPENDIX Q: Parent or Guardian Info
- Page 257 and 258:
Appendices An honorarium of $70 wil
- Page 259 and 260:
Appendices It is important for you
- Page 261 and 262:
Name: ^ School: ^ Date Your home po
- Page 263 and 264:
Appendices * Gab Youth Services (at
- Page 265 and 266:
APPENDIX U: Protocol For Referral F
- Page 267 and 268:
APPENDIX V: Protocol for Referral f
- Page 269 and 270:
Appendices further follow-up. We al
- Page 271 and 272:
APPENDIX W: Parental Letter Informi
- Page 273 and 274:
Appendices APPENDIX Y: Table Y-2: F
- Page 275 and 276:
Appendices APPENDIX Al: Table Al-4:
- Page 277 and 278:
APPENDIX Cl: Table C1-6: Percentage
- Page 279 and 280:
Appendices APPENDIX El: Table El-8:
- Page 281 and 282:
APPENDIX G1: Self-Recognition of De
- Page 283 and 284:
Appendices APPENDIX Il: Table I1-11
- Page 285 and 286:
Category Subcategory Grade x 2 (1,
- Page 287 and 288:
APPENDIX K!: Table K1-13: Associati
- Page 289 and 290:
APPENDIX Ml: UBC Ethics Approval fo


