how do adolescents define depression? - cIRcle - University of ...
how do adolescents define depression? - cIRcle - University of ...
how do adolescents define depression? - cIRcle - University of ...

Create successful ePaper yourself
Turn your PDF publications into a flip-book with our unique Google optimized e-Paper software.
Appendices<br />
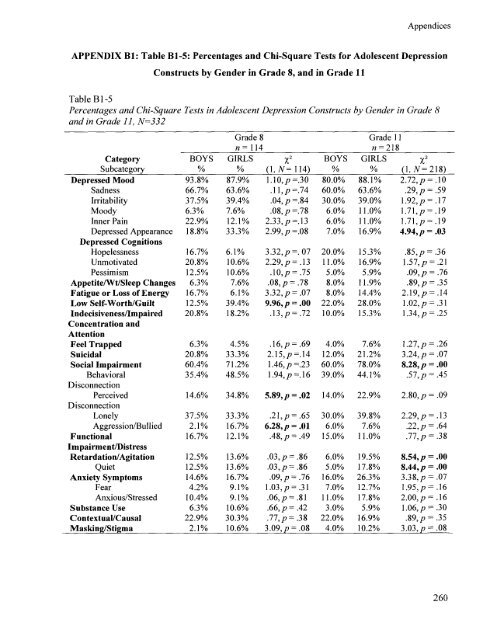
APPENDIX Bl: Table B1-5: Percentages and Chi-Square Tests for A<strong>do</strong>lescent Depression<br />
Constructs by Gender in Grade 8, and in Grade 11<br />
Table B1-5<br />
Percentages and Chi-Square Tests in A<strong>do</strong>lescent Depression Constructs by Gender in Grade 8<br />
and in Grade 11, N=332<br />
Grade 8<br />
Grade 11<br />
n= 114<br />
n = 2 1 8<br />
Category<br />
Subcategory<br />
BOYS GIRLS<br />
%<br />
X2<br />
(1, N= 114)<br />
BOYS<br />
%<br />
GIRLS<br />
%<br />
X2<br />
(1, N= 218)<br />
Depressed Mood 93.8% 87.9% 1.10,p =.30 80.0% 88.1% 2.72,p = .10<br />
Sadness 66.7% 63.6% .11,p =.74 60.0% 63.6% .29,p = .59<br />
Irritability 37.5% 39.4% .04,p =.84 30.0% 39.0% 1.92,p = .17<br />
Moody 6.3% 7.6% .08,p =.78 6.0% 11.0% 1.71,p^.19<br />
Inner Pain 22.9% 12.1% 2.33,p =.13 6.0% 11.0% 1.71,p^.19<br />
Depressed Appearance<br />
Depressed Cognitions<br />
18.8% 33.3% 2.99,p =.08 7.0% 16.9% 4.94,p = .03<br />
Hopelessness 16.7% 6.1% 3.32,p =. 07 20.0% 15.3% .85,p = .36<br />
Unmotivated 20.8% 10.6% 2.29,p = .13 11.0% 16.9% 1.57,p = .21<br />
Pessimism 12.5% 10.6% .10,p = .75 5.0% 5.9% .09,p = .76<br />
Appetite/Wt/Sleep Changes 6.3% 7.6% .08,p = .78 8.0% 11.9% .89,p = .35<br />
Fatigue or Loss <strong>of</strong> Energy 16.7% 6.1% 3.32,p = .07 8.0% 14.4% 2.19,p = .14<br />
Low Self-Worth/Guilt 12.5% 39.4% 9.96,p = .00 22.0% 28.0% 1.02,p = .31<br />
Indecisiveness/Impaired<br />
Concentration and<br />
Attention<br />
20.8% 18.2% .13,p = .72 10.0% 15.3% 1.34,p = .25<br />
Feel Trapped 6.3% 4.5% .16,p = .69 4.0% 7.6% 1.27,p = .26<br />
Suicidal 20.8% 33.3% 2.15,p =.14 12.0% 21.2% 3.24,p = .07<br />
Social Impairment 60.4% 71.2% 1.46,p -.23 60.0% 78.0% 8.28,p = .00<br />
Behavioral<br />
Disconnection<br />
35.4% 48.5% 1.94,p -.16 39.0% 44.1% .57,p = .45<br />
Perceived<br />
Disconnection<br />
14.6% 34.8% 5.89,p = .02 14.0% 22.9% 2.80,p = .09<br />
Lonely 37.5% 33.3% .21,p = .65 30.0% 39.8% 2.29,p = .13<br />
Aggression/Bullied 2.1% 16.7% 6.28,p = .01 6.0% 7.6% .22,p = .64<br />
Functional<br />
Impairment/Distress<br />
16.7% 12.1% .48,p = .49 15.0% 11.0% .77,p = .38<br />
Retardation/Agitation 12.5% 13.6% .03,p = .86 6.0% 19.5% 8.54,p = .00<br />
Quiet 12.5% 13.6% .03,p^.86 5.0% 17.8% 8.44,p = .00<br />
Anxiety Symptoms 14.6% 16.7% .09,p = .76 16.0% 26.3% 3.38, p = .07<br />
Fear 4.2% 9.1% 1.03,p = .31 7.0% 12.7% 1.95,p = .16<br />
Anxious/Stressed 10.4% 9.1% .06,p = .81 11.0% 17.8% 2.00,p = .16<br />
Substance Use 6.3% 10.6% .66,p = .42 3.0% 5.9% 1.06,p = .30<br />
Contextual/Causal 22.9% 30.3% .77,p = .38 22.0% 16.9% .89,p = .35<br />
Masking/Stigma 2.1% 10.6% 3.09, p = .08 4.0% 10.2% 3.03,p = .08<br />
260