- Page 1 and 2:
Free dissemination (Contract TREN/D
- Page 3 and 4:
TABLE OF CONTENTS 0 EXECUTIVE SUMMA
- Page 5 and 6:
6.1.7 Intelligent electronic dimmab
- Page 7 and 8:
LIST OF TABLES Table 1: Simplified
- Page 9 and 10:
Table 68: Category S (slow traffic)
- Page 11 and 12:
Table 144: Overview of ‘Mercury v
- Page 13 and 14:
LIST OF FIGURES Figure 1: Typical s
- Page 15:
Figure 69: Value of lamp production
- Page 18 and 19:
even the luminaire in its entirety
- Page 21 and 22:
1 PRODUCT DEFINITION The goal of th
- Page 23 and 24:
Figure 3: Typical street lighting l
- Page 25 and 26:
• Products such as private outdoo
- Page 27 and 28:
Figure 8: Example of Fast Traffic (
- Page 29 and 30:
“The maintained useful luminous f
- Page 31 and 32:
The two following characters indica
- Page 33 and 34:
parameters influencing the deprecia
- Page 35 and 36:
sum of the individual luminous flux
- Page 37 and 38:
This part of the European Standard
- Page 39 and 40:
(compact) lamps with power equal to
- Page 41 and 42:
Specifies the lamp dimensions, elec
- Page 43 and 44:
Specifies the safety requirements f
- Page 45 and 46:
Exceptions for lamps: this directiv
- Page 47 and 48:
Catalonia 2001: 'LLEI 6/2001, de 31
- Page 49 and 50:
Table 3: Mandatory Label for Ballas
- Page 51 and 52:
Table 7: Voluntary Label for Ballas
- Page 53 and 54:
2 MARKET AND ECONOMIC ANALYSIS The
- Page 55 and 56:
Millions of lamps 45,0 40,0 35,0 30
- Page 57 and 58:
parts no information on production
- Page 59 and 60:
Table 149 and Table 150 in ANNEX E
- Page 61 and 62:
Table 10: Overview of lamp and ball
- Page 63 and 64:
2.2 Market and stock data To overco
- Page 65 and 66:
An introduction message explained t
- Page 67 and 68:
Table 156 and Figure 14 indicate th
- Page 69 and 70:
pronounced, i.e. the apparent consu
- Page 71 and 72:
Road category Road length in 2004 S
- Page 73 and 74:
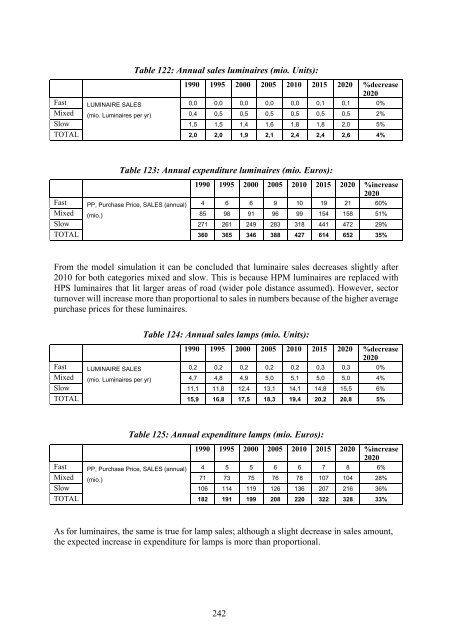
For luminaires we can conclude that
- Page 75 and 76:
causes higher currents and by conse
- Page 77 and 78:
2005 Luminaires TOTAL %EU25 Capita
- Page 79 and 80:
As will be explained in chapter 3 o
- Page 81 and 82:
2.3 Market trends 2.3.1 General tre
- Page 83 and 84:
manufacturers have dominated the in
- Page 85 and 86:
2.4 Consumer expenditure data 2.4.1
- Page 87 and 88:
Public street lighting is mainly op
- Page 89 and 90:
3 CONSUMER BEHAVIOUR AND LOCAL INFR
- Page 91 and 92:
Table 22: Relationship between phot
- Page 93 and 94:
4. Dimming to compensate for Lamp L
- Page 95 and 96:
can overcome this problem. This pow
- Page 97 and 98:
generation of gas discharge lamps i
- Page 99 and 100:
clear that light point locations ca
- Page 101 and 102:
with, Lav = QO x Eavg Table 28: Ave
- Page 103 and 104:
times the height. In category S, th
- Page 105 and 106:
ageing of the overall population wi
- Page 107 and 108:
4 TECHNICAL ANALYSIS EXISTING PRODU
- Page 109 and 110:
lamps. It is unlikely that this wil
- Page 111 and 112:
Table 34: Input data for the manufa
- Page 113 and 114:
Table 37: Input data for the materi
- Page 115 and 116:
The general remarks about this inpu
- Page 117 and 118:
Table 43: Input data for the materi
- Page 119 and 120:
Table 45: Input data for the materi
- Page 121 and 122:
With regard to the different parts
- Page 123 and 124:
Table 49: Input data for the materi
- Page 125 and 126:
Table 53: Input data for the materi
- Page 127 and 128:
Table 55: Input data for the materi
- Page 129 and 130:
are not directly related to a speci
- Page 131 and 132:
4.2 Distribution phase The environm
- Page 133 and 134:
distance between light points is be
- Page 135 and 136:
Until now, existing scientific evid
- Page 137 and 138:
The energy efficiency in the use-ph
- Page 139 and 140:
Table 66: Category S (slow traffic)
- Page 141 and 142:
The real power consumption (Preal)
- Page 143 and 144:
Figure 24: A high amount of light i
- Page 145 and 146:
LPDireal [W/(lx.m²)] = P / LPDi /
- Page 147 and 148:
5 DEFINITION OF THE BASE CASE AND E
- Page 149 and 150:
This results in the following EuP E
- Page 151 and 152:
5.1 BaseCase Lamps and ballasts 5.1
- Page 153 and 154:
Category S In road category S (slow
- Page 155 and 156:
Table 76: Life Cycle Impact per Bas
- Page 157 and 158:
Table 78: Life Cycle Impact per Bas
- Page 159 and 160:
the higher weight of the control ge
- Page 161 and 162:
Table 80: Aggregated Production, Di
- Page 163 and 164:
5.3 BaseCase Sales The results in t
- Page 165 and 166:
5.3.2 Environmental Impact On www.e
- Page 167 and 168:
Table 84: Life Cycle Impact, Base C
- Page 169 and 170:
Table 86: Life Cycle Impact, Base C
- Page 171 and 172:
Table 88: Life Cycle Impact, Base C
- Page 173 and 174:
Table 90: Life Cycle Impact, Base C
- Page 175 and 176:
5.3.3 BaseCase Life Cycle Costs The
- Page 177 and 178:
Table 93: EU Total Impact of NEW Lu
- Page 179 and 180:
Discussion of results Again, EU25 t
- Page 181 and 182:
5.4.2 Environmental Impact Table 96
- Page 183 and 184:
Table 98: Life Cycle Impact, Base C
- Page 185 and 186:
Table 100: Life Cycle Impact, Base
- Page 187 and 188:
Table 102: Impacts sales versus sto
- Page 189 and 190:
6 TECHNICAL ANALYSIS BAT AND BNAT S
- Page 191 and 192: 6.1.3 Luminaires with improved util
- Page 193 and 194: there is an increased reflection on
- Page 195 and 196: MH lamps can have a quite short lam
- Page 197 and 198: Table 105: LSF for various lamp typ
- Page 199 and 200: The energy saving advantages of dim
- Page 201 and 202: 6.2 State of the art of best existi
- Page 203 and 204: 6.3.3 WLEDs lamps Figure 37: Typica
- Page 205 and 206: 7 IMPROVEMENT POTENTIAL 7.1 Introdu
- Page 207 and 208: Option 1 (stock base): HPS retrofit
- Page 209 and 210: • This option is only technically
- Page 211 and 212: 7.2.4 Table with EuP EcoReports for
- Page 213 and 214: LCC in €/1000f-lm 300 250 200 150
- Page 215 and 216: cost indicator (LCC) low high cost
- Page 217 and 218: comfort of outdoor lighting, the fi
- Page 219 and 220: 8 SCENARIO-, POLICY-, IMPACT- AND S
- Page 221 and 222: • For lamps with Ra < 80 power ba
- Page 223 and 224: Burning hours LLMF 16000h >0.90 Bur
- Page 225 and 226: Proposed timing: ASAP because these
- Page 227 and 228: 8.1.1.12 Specific ecodesign require
- Page 229 and 230: Table 107: Aggregated results, Busi
- Page 231 and 232: Table 111: Annual lamp sales, per c
- Page 233 and 234: EU25 electricity consumption, altho
- Page 235 and 236: Table 116: Aggregated results, Scen
- Page 237 and 238: € increase. The increase between
- Page 239 and 240: 500 450 400 350 300 250 200 150 100
- Page 241: 40.000 35.000 30.000 25.000 20.000
- Page 245 and 246: 45000 40000 35000 30000 25000 20000
- Page 247 and 248: anking is from uncertainty in purch
- Page 249 and 250: Uncertainty regarding assumed watta
- Page 251 and 252: Table 131: Forecast of installed ba
- Page 253 and 254: Table 133: Aggregated results, Busi
- Page 255 and 256: taking into account pole removal an
- Page 257 and 258: Recommendation 3: It is also recomm
- Page 259 and 260: 8.2 Impact analysis industry and co
- Page 261 and 262: existing installations could even i
- Page 263 and 264: 9 REFERENCES AFE (2002) Recommandat
- Page 265 and 266: CIE 135-1999: CIE Collection in vis
- Page 267 and 268: Eurostat (2006). Road lengths of di
- Page 269 and 270: 10 ABBREVIATIONS and ACRONYMS Abbre
- Page 271 and 272: IESNA ILCOS IP (rating) IRF ISO L L
- Page 273 and 274: ANNEX A: PRODCOM CATEGORIES OF LIGH
- Page 275 and 276: ANNEX B: EUROPROMS RESULTS FOR LAMP
- Page 277 and 278: Year Region Table 141: Mercury vapo
- Page 279 and 280: ANNEX C: OVERVIEW OF PRODUCTION, TR
- Page 281 and 282: ANNEX D: EUROPROMS RESULTS FOR BALL
- Page 283 and 284: Table 148: Parts (excluding of glas
- Page 285 and 286: ANNEX E: OVERVIEW OF PRODUCTION, TR
- Page 287 and 288: ANNEX F: EUROPROMS RESULTS FOR LUMI
- Page 289 and 290: ANNEX G: OVERVIEW OF LAMP AND BALLA
- Page 291 and 292: Millions of ballasts 600 500 400 30
- Page 293 and 294:
ANNEX H: EXPERT-INQUIRY Preparatory
- Page 295 and 296:
You can already register for Office
- Page 297 and 298:
Road types In our study, we disting
- Page 299 and 300:
General street lighting data - Inst
- Page 301 and 302:
6. Can you give us an estimation ab
- Page 303 and 304:
Standardization of public lighting
- Page 305 and 306:
Roads lit and control 15. What perc
- Page 307 and 308:
Road infrastructure 19. Can you giv
- Page 309 and 310:
Street lighting: Maintenance 22. Is
- Page 311 and 312:
Lamp type NaLP-TC (Low pressure sod
- Page 313 and 314:
lamp type wattage past present futu
- Page 315 and 316:
luminaire type default 1990 adapted
- Page 317 and 318:
ANNEX I: RESPONSE TO “EXPERT-INQU
- Page 319 and 320:
ANNEX J: EU-25 LAMP SALES Table 156
- Page 321 and 322:
ANNEX K: APPARENT CONSUMPTION VERSU
- Page 323 and 324:
Table 160: Apparent consumption of
- Page 325 and 326:
ANNEX L: CELMA MARKET ESTIMATIONS T
- Page 327 and 328:
ANNEX M: INSTALLED BASE OF STREET L
- Page 329 and 330:
ANNEX N: EUROPEAN ROAD NETWORK: 199
- Page 331 and 332:
Table 164: Length of European provi
- Page 333 and 334:
Table 166: Input data regarding roa
- Page 335 and 336:
ANNEX O: EU ROAD INFRASTRUCTURE PRO
- Page 337 and 338:
Economic growth is not uniformly di
- Page 339 and 340:
ANNEX P: STAKEHOLDERS’ LIST First
- Page 341 and 342:
FOTISTIKI SA Pakis Sotiropoulos Gre
- Page 343 and 344:
Large control street office Philips