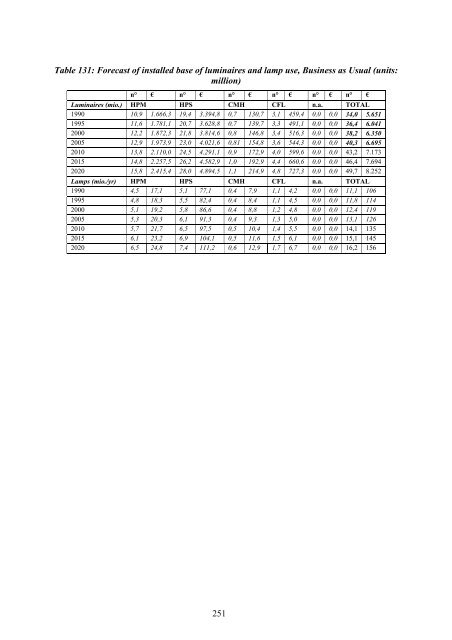
applied recommendations (Sweden, Netherlands, Belgium). Because the model categories have higher <strong>lighting</strong> value requirements from category slow to fast the impact is similar with a shift in % lit roads in a defined catergory. It is likely that in the model, that road category ‘Fast Traffic’ is underestimated because (EUROSTAT) ‘State roads’ and ‘Provincial roads’, are now both and 100% summed under category ‘Mixed Traffic’ but should be partly lit according to ‘Fast Traffic’ <strong>lighting</strong> performance standards. Per 1% road category Mixed to category Fast: total EU25 electricity use decreases with 0,3%. Thus when 10% of State and Provincial roads are lighted as Fast Traffic roads, total EU25 electricity use decreases with 3%. It could also be likely that the amount of communal roads lighted as Mixed Traffic is underestimated. Currently, only 5% of communal roads are allocated to category Mixed Traffic. Per 1% extra communal road to Mixed road, total EU25 electricity use increases with 0,42%. Uncertainty regarding % road infrastructure growth Please note that the implementation of the new standard EN 13201 (2004) series can have a similar impact. Due to the lack of data about existing installations and their compliance with the new standard, the impact of the implementation of this standard could hardly be forecasted. Some installations probably do not comply with the new standard by reason of bad uniformity. Compliance could require installing more poles and thus can result in an increase in 'new lit <strong>street</strong>s' in model terminology. In category slow traffic, for 2005, 40 million base case luminaires were estimated and is hence the largest category in terms of n° luminaires, installed power, associated costs and impacts. Under the base assumption that this category of road is lighted at on average 7,5 lx would mean that approximately 22,5 %km of total road category S is lit (or 720.000 km lit <strong>street</strong>) with this amount of base case luminaires. The growth rate of <strong>street</strong> <strong>lighting</strong> stock is derived from the assumed growth rate of road infrastructure (% km) for this <strong>street</strong> category. Forecasting can be based on the assumption that annual growth rate since 1995 will continue after 2005 (approximately 1 %) but can also be based on the assumption that road infrastructure growth will follow the expected increase in transport activity (approximately 1,7 % annually). An in between value of 1,4% increase annually has been taken for the scenario analysis. At the same time, there are no indications to assume a relative growth of km lit <strong>street</strong> (km lit <strong>street</strong> / km total <strong>street</strong> remains 22,5%). In 2020, the amount of installed luminaires for this <strong>street</strong> category (slow traffic) is then between 47 mio. and 52,5 mio. depending on the underlying assumption for <strong>street</strong> <strong>lighting</strong> growth. Related annual lamp sales will than vary from 15 to 17 mio. units. In Table 131 and Table 132 the values are given for the amount of installed luminaires and related annual lamp use. Based on annual growth rate before 2005 (1%), expected luminaire life and installed base; luminaire replacement sales can be calculated. For category slow, in 2005, this amounts up to about 75% to 80% of total new luminaire sales. The so-called ‘lock-in effect’ can thus not be underestimated in this category. 250
Table 131: Forecast of installed base of luminaires and lamp use, Business as Usual (units: million) n° € n° € n° € n° € n° € n° € Luminaires (mio.) HPM HPS CMH CFL n.a. TOTAL 1990 10,9 1.666,3 19,4 3.394,8 0,7 130,7 3,1 459,4 0,0 0,0 34,0 5.651 1995 11,6 1.781,1 20,7 3.628,8 0,7 139,7 3,3 491,1 0,0 0,0 36,4 6.041 2000 12,2 1.872,3 21,8 3.814,6 0,8 146,8 3,4 516,3 0,0 0,0 38,2 6.350 2005 12,9 1.973,9 23,0 4.021,6 0,81 154,8 3,6 544,3 0,0 0,0 40,3 6.695 2010 13,8 2.110,0 24,5 4.291,1 0,9 172,9 4,0 599,6 0,0 0,0 43,2 7.173 2015 14,8 2.257,5 26,2 4.582,9 1,0 192,9 4,4 660,6 0,0 0,0 46,4 7.694 2020 15,8 2.415,4 28,0 4.894,5 1,1 214,9 4,8 727,3 0,0 0,0 49,7 8.252 Lamps (mio./yr) HPM HPS CMH CFL n.a. TOTAL 1990 4,5 17,1 5,1 77,1 0,4 7,9 1,1 4,2 0,0 0,0 11,1 106 1995 4,8 18,3 5,5 82,4 0,4 8,4 1,1 4,5 0,0 0,0 11,8 114 2000 5,1 19,2 5,8 86,6 0,4 8,8 1,2 4,8 0,0 0,0 12,4 119 2005 5,3 20,3 6,1 91,3 0,4 9,3 1,3 5,0 0,0 0,0 13,1 126 2010 5,7 21,7 6,5 97,5 0,5 10,4 1,4 5,5 0,0 0,0 14,1 135 2015 6,1 23,2 6,9 104,1 0,5 11,6 1,5 6,1 0,0 0,0 15,1 145 2020 6,5 24,8 7,4 111,2 0,6 12,9 1,7 6,7 0,0 0,0 16,2 156 251
- Page 1 and 2:
Free dissemination (Contract TREN/D
- Page 3 and 4:
TABLE OF CONTENTS 0 EXECUTIVE SUMMA
- Page 5 and 6:
6.1.7 Intelligent electronic dimmab
- Page 7 and 8:
LIST OF TABLES Table 1: Simplified
- Page 9 and 10:
Table 68: Category S (slow traffic)
- Page 11 and 12:
Table 144: Overview of ‘Mercury v
- Page 13 and 14:
LIST OF FIGURES Figure 1: Typical s
- Page 15:
Figure 69: Value of lamp production
- Page 18 and 19:
even the luminaire in its entirety
- Page 21 and 22:
1 PRODUCT DEFINITION The goal of th
- Page 23 and 24:
Figure 3: Typical street lighting l
- Page 25 and 26:
• Products such as private outdoo
- Page 27 and 28:
Figure 8: Example of Fast Traffic (
- Page 29 and 30:
“The maintained useful luminous f
- Page 31 and 32:
The two following characters indica
- Page 33 and 34:
parameters influencing the deprecia
- Page 35 and 36:
sum of the individual luminous flux
- Page 37 and 38:
This part of the European Standard
- Page 39 and 40:
(compact) lamps with power equal to
- Page 41 and 42:
Specifies the lamp dimensions, elec
- Page 43 and 44:
Specifies the safety requirements f
- Page 45 and 46:
Exceptions for lamps: this directiv
- Page 47 and 48:
Catalonia 2001: 'LLEI 6/2001, de 31
- Page 49 and 50:
Table 3: Mandatory Label for Ballas
- Page 51 and 52:
Table 7: Voluntary Label for Ballas
- Page 53 and 54:
2 MARKET AND ECONOMIC ANALYSIS The
- Page 55 and 56:
Millions of lamps 45,0 40,0 35,0 30
- Page 57 and 58:
parts no information on production
- Page 59 and 60:
Table 149 and Table 150 in ANNEX E
- Page 61 and 62:
Table 10: Overview of lamp and ball
- Page 63 and 64:
2.2 Market and stock data To overco
- Page 65 and 66:
An introduction message explained t
- Page 67 and 68:
Table 156 and Figure 14 indicate th
- Page 69 and 70:
pronounced, i.e. the apparent consu
- Page 71 and 72:
Road category Road length in 2004 S
- Page 73 and 74:
For luminaires we can conclude that
- Page 75 and 76:
causes higher currents and by conse
- Page 77 and 78:
2005 Luminaires TOTAL %EU25 Capita
- Page 79 and 80:
As will be explained in chapter 3 o
- Page 81 and 82:
2.3 Market trends 2.3.1 General tre
- Page 83 and 84:
manufacturers have dominated the in
- Page 85 and 86:
2.4 Consumer expenditure data 2.4.1
- Page 87 and 88:
Public street lighting is mainly op
- Page 89 and 90:
3 CONSUMER BEHAVIOUR AND LOCAL INFR
- Page 91 and 92:
Table 22: Relationship between phot
- Page 93 and 94:
4. Dimming to compensate for Lamp L
- Page 95 and 96:
can overcome this problem. This pow
- Page 97 and 98:
generation of gas discharge lamps i
- Page 99 and 100:
clear that light point locations ca
- Page 101 and 102:
with, Lav = QO x Eavg Table 28: Ave
- Page 103 and 104:
times the height. In category S, th
- Page 105 and 106:
ageing of the overall population wi
- Page 107 and 108:
4 TECHNICAL ANALYSIS EXISTING PRODU
- Page 109 and 110:
lamps. It is unlikely that this wil
- Page 111 and 112:
Table 34: Input data for the manufa
- Page 113 and 114:
Table 37: Input data for the materi
- Page 115 and 116:
The general remarks about this inpu
- Page 117 and 118:
Table 43: Input data for the materi
- Page 119 and 120:
Table 45: Input data for the materi
- Page 121 and 122:
With regard to the different parts
- Page 123 and 124:
Table 49: Input data for the materi
- Page 125 and 126:
Table 53: Input data for the materi
- Page 127 and 128:
Table 55: Input data for the materi
- Page 129 and 130:
are not directly related to a speci
- Page 131 and 132:
4.2 Distribution phase The environm
- Page 133 and 134:
distance between light points is be
- Page 135 and 136:
Until now, existing scientific evid
- Page 137 and 138:
The energy efficiency in the use-ph
- Page 139 and 140:
Table 66: Category S (slow traffic)
- Page 141 and 142:
The real power consumption (Preal)
- Page 143 and 144:
Figure 24: A high amount of light i
- Page 145 and 146:
LPDireal [W/(lx.m²)] = P / LPDi /
- Page 147 and 148:
5 DEFINITION OF THE BASE CASE AND E
- Page 149 and 150:
This results in the following EuP E
- Page 151 and 152:
5.1 BaseCase Lamps and ballasts 5.1
- Page 153 and 154:
Category S In road category S (slow
- Page 155 and 156:
Table 76: Life Cycle Impact per Bas
- Page 157 and 158:
Table 78: Life Cycle Impact per Bas
- Page 159 and 160:
the higher weight of the control ge
- Page 161 and 162:
Table 80: Aggregated Production, Di
- Page 163 and 164:
5.3 BaseCase Sales The results in t
- Page 165 and 166:
5.3.2 Environmental Impact On www.e
- Page 167 and 168:
Table 84: Life Cycle Impact, Base C
- Page 169 and 170:
Table 86: Life Cycle Impact, Base C
- Page 171 and 172:
Table 88: Life Cycle Impact, Base C
- Page 173 and 174:
Table 90: Life Cycle Impact, Base C
- Page 175 and 176:
5.3.3 BaseCase Life Cycle Costs The
- Page 177 and 178:
Table 93: EU Total Impact of NEW Lu
- Page 179 and 180:
Discussion of results Again, EU25 t
- Page 181 and 182:
5.4.2 Environmental Impact Table 96
- Page 183 and 184:
Table 98: Life Cycle Impact, Base C
- Page 185 and 186:
Table 100: Life Cycle Impact, Base
- Page 187 and 188:
Table 102: Impacts sales versus sto
- Page 189 and 190:
6 TECHNICAL ANALYSIS BAT AND BNAT S
- Page 191 and 192:
6.1.3 Luminaires with improved util
- Page 193 and 194:
there is an increased reflection on
- Page 195 and 196:
MH lamps can have a quite short lam
- Page 197 and 198:
Table 105: LSF for various lamp typ
- Page 199 and 200: The energy saving advantages of dim
- Page 201 and 202: 6.2 State of the art of best existi
- Page 203 and 204: 6.3.3 WLEDs lamps Figure 37: Typica
- Page 205 and 206: 7 IMPROVEMENT POTENTIAL 7.1 Introdu
- Page 207 and 208: Option 1 (stock base): HPS retrofit
- Page 209 and 210: • This option is only technically
- Page 211 and 212: 7.2.4 Table with EuP EcoReports for
- Page 213 and 214: LCC in €/1000f-lm 300 250 200 150
- Page 215 and 216: cost indicator (LCC) low high cost
- Page 217 and 218: comfort of outdoor lighting, the fi
- Page 219 and 220: 8 SCENARIO-, POLICY-, IMPACT- AND S
- Page 221 and 222: • For lamps with Ra < 80 power ba
- Page 223 and 224: Burning hours LLMF 16000h >0.90 Bur
- Page 225 and 226: Proposed timing: ASAP because these
- Page 227 and 228: 8.1.1.12 Specific ecodesign require
- Page 229 and 230: Table 107: Aggregated results, Busi
- Page 231 and 232: Table 111: Annual lamp sales, per c
- Page 233 and 234: EU25 electricity consumption, altho
- Page 235 and 236: Table 116: Aggregated results, Scen
- Page 237 and 238: € increase. The increase between
- Page 239 and 240: 500 450 400 350 300 250 200 150 100
- Page 241 and 242: 40.000 35.000 30.000 25.000 20.000
- Page 243 and 244: Table 126: LCC of luminaire sales i
- Page 245 and 246: 45000 40000 35000 30000 25000 20000
- Page 247 and 248: anking is from uncertainty in purch
- Page 249: Uncertainty regarding assumed watta
- Page 253 and 254: Table 133: Aggregated results, Busi
- Page 255 and 256: taking into account pole removal an
- Page 257 and 258: Recommendation 3: It is also recomm
- Page 259 and 260: 8.2 Impact analysis industry and co
- Page 261 and 262: existing installations could even i
- Page 263 and 264: 9 REFERENCES AFE (2002) Recommandat
- Page 265 and 266: CIE 135-1999: CIE Collection in vis
- Page 267 and 268: Eurostat (2006). Road lengths of di
- Page 269 and 270: 10 ABBREVIATIONS and ACRONYMS Abbre
- Page 271 and 272: IESNA ILCOS IP (rating) IRF ISO L L
- Page 273 and 274: ANNEX A: PRODCOM CATEGORIES OF LIGH
- Page 275 and 276: ANNEX B: EUROPROMS RESULTS FOR LAMP
- Page 277 and 278: Year Region Table 141: Mercury vapo
- Page 279 and 280: ANNEX C: OVERVIEW OF PRODUCTION, TR
- Page 281 and 282: ANNEX D: EUROPROMS RESULTS FOR BALL
- Page 283 and 284: Table 148: Parts (excluding of glas
- Page 285 and 286: ANNEX E: OVERVIEW OF PRODUCTION, TR
- Page 287 and 288: ANNEX F: EUROPROMS RESULTS FOR LUMI
- Page 289 and 290: ANNEX G: OVERVIEW OF LAMP AND BALLA
- Page 291 and 292: Millions of ballasts 600 500 400 30
- Page 293 and 294: ANNEX H: EXPERT-INQUIRY Preparatory
- Page 295 and 296: You can already register for Office
- Page 297 and 298: Road types In our study, we disting
- Page 299 and 300: General street lighting data - Inst
- Page 301 and 302:
6. Can you give us an estimation ab
- Page 303 and 304:
Standardization of public lighting
- Page 305 and 306:
Roads lit and control 15. What perc
- Page 307 and 308:
Road infrastructure 19. Can you giv
- Page 309 and 310:
Street lighting: Maintenance 22. Is
- Page 311 and 312:
Lamp type NaLP-TC (Low pressure sod
- Page 313 and 314:
lamp type wattage past present futu
- Page 315 and 316:
luminaire type default 1990 adapted
- Page 317 and 318:
ANNEX I: RESPONSE TO “EXPERT-INQU
- Page 319 and 320:
ANNEX J: EU-25 LAMP SALES Table 156
- Page 321 and 322:
ANNEX K: APPARENT CONSUMPTION VERSU
- Page 323 and 324:
Table 160: Apparent consumption of
- Page 325 and 326:
ANNEX L: CELMA MARKET ESTIMATIONS T
- Page 327 and 328:
ANNEX M: INSTALLED BASE OF STREET L
- Page 329 and 330:
ANNEX N: EUROPEAN ROAD NETWORK: 199
- Page 331 and 332:
Table 164: Length of European provi
- Page 333 and 334:
Table 166: Input data regarding roa
- Page 335 and 336:
ANNEX O: EU ROAD INFRASTRUCTURE PRO
- Page 337 and 338:
Economic growth is not uniformly di
- Page 339 and 340:
ANNEX P: STAKEHOLDERS’ LIST First
- Page 341 and 342:
FOTISTIKI SA Pakis Sotiropoulos Gre
- Page 343 and 344:
Large control street office Philips