Project Cyclops, A Design... - Department of Earth and Planetary ...
Project Cyclops, A Design... - Department of Earth and Planetary ...
Project Cyclops, A Design... - Department of Earth and Planetary ...

Create successful ePaper yourself
Turn your PDF publications into a flip-book with our unique Google optimized e-Paper software.
<strong>and</strong> the required calculation time is<br />
To _ 2(Nlog2N) 10-6 SeC (5)<br />
Now let us determine what sort <strong>of</strong> b<strong>and</strong>widths may<br />
be efficiently analyzed on a real time basis with a<br />
hard-wired fast Fourier transformer. For this let<br />
T = recording time necessary to achieve the desired<br />
frequency resolution (1/T) in the spectrum<br />
B = b<strong>and</strong>width h<strong>and</strong>led per analyzer<br />
N = number <strong>of</strong> data points per recording <strong>of</strong> signal<br />
3BT (to prevent aliasing)<br />
We assume that, for a given channel, two FFTs are used<br />
alternately to achieve real-time operation. One analyzes<br />
while the other is recording. It is clear that if To > T the<br />
analyzing unit will fall behind, while if To < T it will be<br />
idle some <strong>of</strong> the time. Thus, for most efficient operation<br />
T = To <strong>and</strong> we have<br />
or<br />
T = 2(Nlog2N) 10--6<br />
T = 2(3BTlog23BT) 10--6<br />
dimensional Fourier transform <strong>of</strong> the complex amplitude<br />
distribution over the front focal plane (ref.7).<br />
(Note: the front <strong>and</strong> back focal planes are each one focal<br />
length from the corresponding principal plane <strong>and</strong> are<br />
not the object <strong>and</strong> image planes.) The intensity distribution<br />
over the back focal plane is thus the two<br />
dimensional power spectrum <strong>of</strong> the front focal plane<br />
distribution. Because <strong>of</strong> these relationships <strong>and</strong>, because<br />
lenses have enormous information transmission capacity,<br />
coherent optical systems are widely used to obtain two<br />
dimensional power spectra. Not so well known is the<br />
fact that this large information rate <strong>of</strong> lenses can be used<br />
efficiently to obtain the power spectra <strong>of</strong> one dimensional<br />
signals (refs. 8,9).<br />
The signal to be analyzed is recorded in a raster scan<br />
on a strip <strong>of</strong> photographic film or other suitable medium<br />
so that after development the transmittance <strong>of</strong> the film<br />
is directly proportional to the signal amplitude. Adc<br />
bias or <strong>of</strong>fset is added to the signal (or in the light<br />
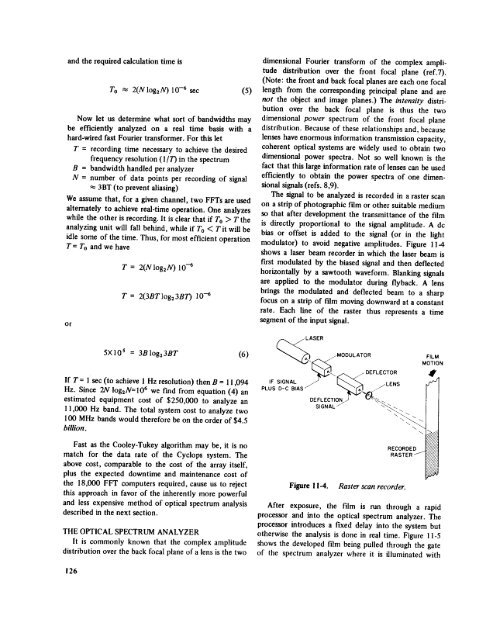
modulator) to avoid negative amplitudes. Figure 11-4<br />
shows a laser beam recorder in which the laser beam is<br />
first modulated by the biased signal <strong>and</strong> then deflected<br />
horizontally by a sawtooth waveform. Blanking signals<br />
are applied to the modulator during flyback. A lens<br />
brings the modulated <strong>and</strong> deflected beam to a sharp<br />
focus on a strip <strong>of</strong> film moving downward at a constant<br />
rate. Each line <strong>of</strong> the raster thus represents a time<br />
segment <strong>of</strong> the input signal.<br />
5X10 s = 3BIog23BT (6)<br />
If T = l sec (to achieve 1 Hz resolution) then B = 11,094<br />
Hz. Since 2N log2N=106 we f'md from equation (4) an<br />
estimated equipment cost <strong>of</strong> $250,000 to analyze an<br />
l 1,000 Hz b<strong>and</strong>. The total system cost to analyze two<br />
100 MHz b<strong>and</strong>s would therefore be on the order <strong>of</strong> $4.5<br />
billion.<br />
Fast as the Cooley-Tukey algorithm may be, it is no<br />
match for the data rate <strong>of</strong> the <strong>Cyclops</strong> system. The<br />
above cost, comparable to the cost <strong>of</strong> the array itself,<br />
plus the expected downtime <strong>and</strong> maintenance cost <strong>of</strong><br />
the 18,000 FFT computers required, cause us to reject<br />
this approach in favor <strong>of</strong> the inherently more powerful<br />
<strong>and</strong> less expensive method <strong>of</strong> optical spectrum analysis<br />
described in the next section.<br />
THE OPTICAL SPECTRUM ANALYZER<br />
it is commonly known that the complex amplitude<br />
distribution over the back focal plane <strong>of</strong> a lens is the two<br />
ASER<br />
A /MODULATOR FILM<br />
MOT,ON<br />
S,GNAL zLENS r"-'<br />
'OSD-C<br />
DEFLECTION//<br />
v_<br />
SIGNAL / \_._<br />
RECORDED<br />
Figure 11.4. Raster scan recorder.<br />
RASTER /<br />
After exposure, the film is run through a rapid<br />
processor <strong>and</strong> into the optical spectrum analyzer. The<br />
processor introduces a fixed delay into the system but<br />
otherwise the analysis is done in real time. Figure I 1-5<br />
shows the developed film being pulled through the gate<br />
<strong>of</strong> the spectrum analyzer where it is illuminated with<br />
H<br />
126