Project Cyclops, A Design... - Department of Earth and Planetary ...
Project Cyclops, A Design... - Department of Earth and Planetary ...
Project Cyclops, A Design... - Department of Earth and Planetary ...

Create successful ePaper yourself
Turn your PDF publications into a flip-book with our unique Google optimized e-Paper software.
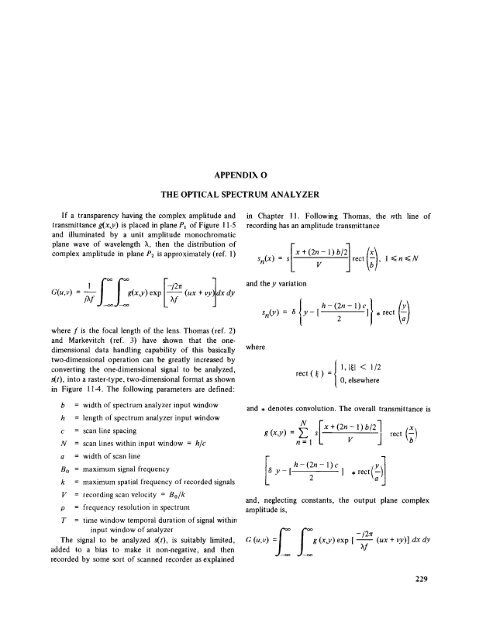
APPENDIXO<br />
THE OPTICAL SPECTRUM ANALYZER<br />
If a transparency having the complex amplitude <strong>and</strong><br />
transmittance g(x,y) is placed in plane PI <strong>of</strong> Figure 11-5<br />
<strong>and</strong> illuminated by a unit amplitude monochromatic<br />
plane wave <strong>of</strong> wavelength k, then the distribution <strong>of</strong><br />
complex amplitude in plane P2 is approximately (ref. 1)<br />
in Chapter 11. Following Thomas, the nth line <strong>of</strong><br />
recording has an amplitude transmittance<br />
Sn(X ) = s V" rect , 1 _n_N<br />
1 foo foo F_i2n(ux+vyTdxdy<br />
-- LI'---- 1<br />
<strong>and</strong> the y variation<br />
Sn(Y ) = 6 { y- [ h-(2n-l)c]}*rect(y)<br />
2<br />
where f is the focal length <strong>of</strong> the lens. Thomas (ref. 2)<br />
<strong>and</strong> Markevitch (ref. 3) have shown that the onedimensional<br />
data h<strong>and</strong>ling capability <strong>of</strong> this basically<br />
two-dimensional operation can be greatly increased by<br />
converting the one-dimensional signal to be analyzed,<br />
s(t), into a raster-type, two-dimensional format as shown<br />
in Figure 11-4. The following parameters are defined:<br />
where<br />
rect ( _ ) = O, 1,1_1 elsewhere < 1/2<br />
b = width <strong>of</strong> spectrum analyzer input window<br />
h = length <strong>of</strong> spectrum analyzer input window<br />
c = scan line spacing<br />
N = scan lines within input window = hie<br />
<strong>and</strong> , denotes convolution. The overall transmittance is<br />
g(x,y) = Z S I rect<br />
n=l V ,<br />
a = width <strong>of</strong> scan line<br />
B0 = maximum signal frequency<br />
k = maximum spatial frequency <strong>of</strong> recorded signals<br />
V = recording scan velocity = Bo/k<br />
p = frequency resolution in spectrum<br />
T = time window temporal duration <strong>of</strong> signal within<br />
input window <strong>of</strong> analyzer<br />
The signal to be analyzed s(t), is suitably limited,<br />
added to a bias to make it non-negative, <strong>and</strong> then<br />
recorded by some sort <strong>of</strong> scanned recorder as explained<br />
Y- [ 2 ] , rect<br />
<strong>and</strong>, neglecting constants, the output plane complex<br />
amplitude is,<br />
G (u,v) =f_ y_ g (x,y) exp -/2n l --'if'- (ux + vy)] dx dy<br />
229