Project Cyclops, A Design... - Department of Earth and Planetary ...
Project Cyclops, A Design... - Department of Earth and Planetary ...
Project Cyclops, A Design... - Department of Earth and Planetary ...

You also want an ePaper? Increase the reach of your titles
YUMPU automatically turns print PDFs into web optimized ePapers that Google loves.
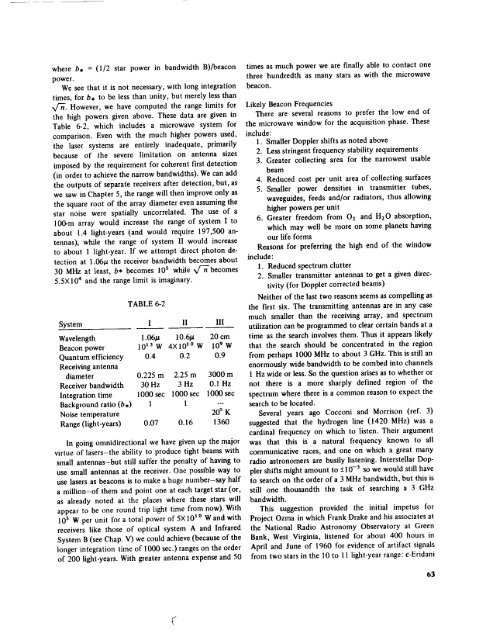
whereb, = (1/2 star power in b<strong>and</strong>width B)/beacon<br />
power.<br />
We see that it is not necessary, with long integration<br />
times, for b, to be less than unity, but merely less than<br />
x/r'ft. However, we have computed the range limits for<br />
the high powers given above. These data are given in<br />
Table 6-2, which includes a microwave system for<br />
comparison. Even with the much higher powers used,<br />
the laser systems are entirely inadequate, primarily<br />
because <strong>of</strong> the severe limitation on antenna sizes<br />
imposed by the requirement for coherent first detection<br />
(in order to achieve the narrow b<strong>and</strong>widths). We can add<br />
the outputs <strong>of</strong> separate receivers after detection, but, as<br />
we saw in Chapter 5, the range will then improve only as<br />
the square root <strong>of</strong> the array diameter even assuming the<br />
star noise were spatially uncorrelated. The use <strong>of</strong> a<br />
100-m array would increase the range <strong>of</strong> system I to<br />
about 1.4 light-years (<strong>and</strong> would require 197,500 antennas),<br />
while the range <strong>of</strong> system II would increase<br />
to about 1 light-year. If we attempt direct photon detection<br />
at 1.061a the receiver b<strong>and</strong>width becomes about<br />
30 MHz at least, b* becomes lO s while wr-h'-becomes<br />
5.5× 10⁴ <strong>and</strong> the range limit is imaginary.<br />
TABLE 6-2<br />
System I II III<br />
Wavelength 1.06/a 10.6/a 20 crn<br />
Beacon power 1013 W 4X10 I° W 10 9 W<br />
Quantum efficiency 0.4 0.2 0.9<br />
Receiving antenna<br />
diameter 0.225 m 2.25 m 3000m<br />
Receiver b<strong>and</strong>width 30 Hz 3 Hz 0.1 Hz<br />
Integration time 1000 sec 1000 sec 1000 see<br />
Background ratio (b,) 1 1 ---<br />
Noise temperature<br />
20 ° K<br />
Range (light-years) 0.07 O. 16 1360<br />
In going omnidirectional we have given up the major<br />
virtue <strong>of</strong> lasers-the ability to produce tight beams with<br />
small antennas-but still suffer the penalty <strong>of</strong> having to<br />
use small antennas at the receiver. One possible way to<br />
use lasers as beacons is to make a huge number-say half<br />
a million-<strong>of</strong> them <strong>and</strong> point one at each target star (or,<br />
as already noted at the places where these stars will<br />
appear to be one round trip light time from now). With<br />
l0 s W per unit for a total power <strong>of</strong>5×10 _° W<strong>and</strong> with<br />
receivers like those <strong>of</strong> optical system A <strong>and</strong> Infrared<br />
System B (see Chap. V) we could achieve (because <strong>of</strong> the<br />
longer integration time <strong>of</strong> 1000 sec.) ranges on the order<br />
<strong>of</strong> 200 light-years. With greater antenna expense <strong>and</strong> 50<br />
times as much power we are finally able to contact one<br />
three hundredth as many stars as with the microwave<br />
beacon.<br />
Likely Beacon Frequencies<br />
There are several reasons to prefer the low end <strong>of</strong><br />
the microwave window for the acquisition phase. These<br />
include:<br />
1. Smaller Doppler shifts as noted above<br />
2. Less stringent frequency stability requirements<br />
3. Greater collecting area for the narrowest usable<br />
beam<br />
4. Reduced cost per unit area <strong>of</strong> collecting surfaces<br />
5. Smaller power densities in transmitter tubes,<br />
waveguides, feeds <strong>and</strong>/or radiators, thus allowing<br />
higher powers per unit<br />
6. Greater freedom from O2 <strong>and</strong> H20 absorption,<br />
which may well be more on some planets having<br />
our life forms<br />
Reasons for preferring the high end <strong>of</strong> the window<br />
include:<br />
1. Reduced spectrum clutter<br />
2. Smaller transmitter antennas to get a given directivity<br />
(for Doppler corrected beams)<br />
Neither <strong>of</strong> the last two reasons seems as compelling as<br />
the first six. The transmitting antennas are in any case<br />
much smaller than the receiving array, <strong>and</strong> spectrum<br />
utilization can be programmed to clear certain b<strong>and</strong>s at a<br />
time as the search involves them. Thus it appears likely<br />
that the search should be concentrated in the region<br />
from perhaps 1000 MHz to about 3 GHz. This is still an<br />
enormously wide b<strong>and</strong>width to be combed into channels<br />
1 Hz wide or less. So the question arises as to whether or<br />
not there is a more sharply defined region <strong>of</strong> the<br />
spectrum where there is a common reason to expect the<br />
search to be located.<br />
Several years ago Cocconi <strong>and</strong> Morrison (ref. 3)<br />
suggested that the hydrogen line (1420 MHz) was a<br />
cardinal frequency on which to listen. Their argument<br />
was that this is a natural frequency known to all<br />
communicative races, <strong>and</strong> one on which a great many<br />
radio astronomers are busily listening. Interstellar Doppler<br />
shifts might amount to +10 -a so we would still have<br />
to search on the order <strong>of</strong> a 3 MHz b<strong>and</strong>width, but this is<br />
still one thous<strong>and</strong>th the task <strong>of</strong> searching a 3 GHz<br />
b<strong>and</strong>width.<br />
This suggestion provided the initial impetus for<br />
<strong>Project</strong> Ozma in which Frank Drake <strong>and</strong> his associates at<br />
the National Radio Astronomy Observatory at Green<br />
Bank, West Virginia, listened for about 400 hours in<br />
April <strong>and</strong> June <strong>of</strong> 1960 for evidence <strong>of</strong> artifact signals<br />
from two stars in the 10 to 11 light-year range: e-Eridani<br />
b3