Project Cyclops, A Design... - Department of Earth and Planetary ...
Project Cyclops, A Design... - Department of Earth and Planetary ...
Project Cyclops, A Design... - Department of Earth and Planetary ...

You also want an ePaper? Increase the reach of your titles
YUMPU automatically turns print PDFs into web optimized ePapers that Google loves.
asshownin AppendixD, if thenoisein successive<br />
samples isuncorrelated, theprobability thatthisaverage<br />
exceeds agiventhresholdvalue<strong>of</strong>y =YT is<br />
n-1<br />
poO, T) = e -YT _ yTkk! (35)<br />
k=O<br />
If both signal <strong>and</strong> noise are present, the probability<br />
that the same threshold is not exceeded is:<br />
n-!<br />
pl(yT) = n + Y) ln_l(2nx/"_)dy<br />
foYT (Y) 2 e -n(r<br />
(36)<br />
I i i T I I q<br />
a<br />
bJ<br />
o<br />
x<br />
LI3<br />
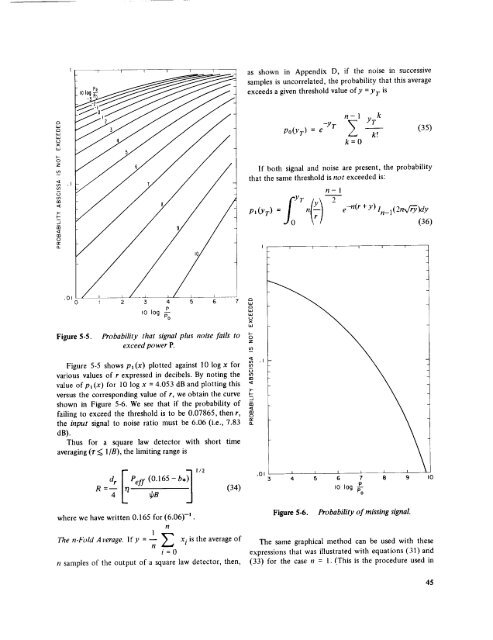
Figure 5-5. Probability that signal plus noise fails to<br />
exceed power P.<br />
Z<br />
Figure 5-5 shows pl(x) plotted against 10 log x for<br />
various values <strong>of</strong> r expressed in decibels. By noting the<br />
value <strong>of</strong> pl(x) for 10 log x = 4.053 dB <strong>and</strong> plotting this<br />
versus the corresponding value <strong>of</strong> r, we obtain the curve<br />
shown in Figure 5-6. We see that if the probability <strong>of</strong><br />
failing to exceed the threshold is to be 0.07865, then r,<br />
the input signal to noise ratio must be 6.06 (i.e., 7.83<br />
dB).<br />
Thus for a square law detector with short time<br />
averaging (r _ 1/B), the limiting range is<br />
IJ<br />
..3<br />
dr Pelf (0.165 - b.<br />
R = -- - (34)<br />
f I 1/2<br />
4 _B<br />
.01 I I I t I I<br />
3 4 5 6 7 B 9 I0<br />
_o log _<br />
where we have written 0.165 for (6.06) -n .<br />
The n-bbM Average. lfy = -- _ x i is the average <strong>of</strong><br />
n<br />
i=0<br />
n samples <strong>of</strong> the output <strong>of</strong> a square law detector, then,<br />
1<br />
n<br />
Figure 5-6. Probability <strong>of</strong> missing signal.<br />
The same graphical method can be used with these<br />
expressions that was illustrated with equations (31)<strong>and</strong><br />
(33) for the case n = 1. (This is the procedure used in<br />
45