Project Cyclops, A Design... - Department of Earth and Planetary ...
Project Cyclops, A Design... - Department of Earth and Planetary ...
Project Cyclops, A Design... - Department of Earth and Planetary ...

You also want an ePaper? Increase the reach of your titles
YUMPU automatically turns print PDFs into web optimized ePapers that Google loves.
MAIN SEQUENCE SPECTRAL CLASS<br />
05 BO AO FOGO I_0 WO<br />
L,<br />
L o<br />
3.5<br />
(2)<br />
6 _ IORo \ "\" SUPERGIANTS<br />
\, \'\\\\<br />
0<br />
X<br />
1,000,000<br />
_l-T-_ I I I I<br />
I I I I I II I I I l I TT -FTT]<br />
I<br />
- \<br />
4 F Ro \ , -.<br />
o 2 R e \<br />
I \<br />
L9 i<br />
C, ' \-,<br />
-J 0 Re<br />
\. ,\<br />
_.<br />
_-,.\<br />
\<br />
GIANTS<br />
\<br />
MAIN<br />
SEQUENCE<br />
.5 N<br />
I<br />
z<br />
z<br />
_<br />
5 :_<br />
I0 z<br />
20 o<br />
5o _<br />
_ I0,000<br />
E<br />
_' ,oo<br />
I-.-<br />
0<br />
Z<br />
IE<br />
[<br />
.0_ _- -_ "_<br />
J<br />
/<br />
/<br />
/i D _o<br />
• I<br />
-2<br />
-4<br />
WHITE _\ _\\,<br />
DWARFS _ _<br />
I00 F-<br />
t_<br />
c3<br />
w<br />
.0001<br />
.02<br />
L i 111111 i i i i illll i i i i tlllJ i i 1 ii<br />
.i 1.0 i0 60<br />
MASS, SOIOrmosses<br />
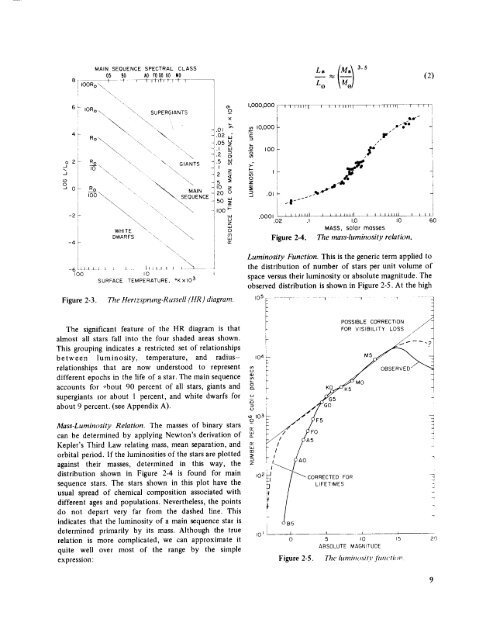
Figure 2-4. The mass-luminosity relation.<br />
\<br />
-6<br />
I00<br />
\<br />
\.<br />
111 1 1 1 _ lit I 1 1 I<br />
I0<br />
SURFACE TEMPERATURE, °KxIO 3<br />
Luminosity Function. This is the generic term applied to<br />
the distribution <strong>of</strong> number <strong>of</strong> stars per unit volume <strong>of</strong><br />
space versus their luminosity or absolute magnitude. The<br />
observed distribution is shown in Figure 2-5. At the high<br />
Figure 2-3. The Hertzsprung-Russell (HR ) diagram.<br />
10 5 - _ ] l r<br />
The significant feature <strong>of</strong> the HR diagram is that<br />
almost all stars fall into the four shaded areas shown.<br />
This grouping indicates a restricted set <strong>of</strong> relationships<br />
between luminosity, temperature, <strong>and</strong> radiusrelationships<br />
that are now understood to represent<br />
different epochs in the life <strong>of</strong> a star. The main sequence<br />
accounts for _bout 90 percent <strong>of</strong> all stars, giants <strong>and</strong><br />
supergiants [or about 1 percent, <strong>and</strong> white dwarfs for<br />
about 9 percent. (see Appendix A).<br />
Mass-Luminosity Relation. The masses <strong>of</strong> binary stars<br />
can be determined by applying Newton's derivation <strong>of</strong><br />
Kepler's Third Law relating mass, mean separation, <strong>and</strong><br />
orbital period. If the luminosities <strong>of</strong> the stars are plotted<br />
against their masses, determined in this way, the<br />
distribution shown in Figure 2-4 is found for main<br />
sequence stars. The stars shown in this plot have the<br />
usual spread <strong>of</strong> chemical composition associated with<br />
different ages <strong>and</strong> populations. Nevertheless, the points<br />
do not depart very far from the dashed line. This<br />
indicates that the luminosity <strong>of</strong> a main sequence star is<br />
determined primarily by its mass. Although the true<br />
relation is more complicated, we can approximate it<br />
quite well over most <strong>of</strong> the range by the simple<br />
expression:<br />
i0 1 I I J I<br />
0 5 _0 15 20<br />
ABSOLUTE MAGNITUDE<br />
Figure 2-5. The luminosity ]im('ti(m