- Page 1 and 2:
(NASA-CR- 11_5) PROJECT CYCLOPS: A
- Page 3 and 4:
CR 114445 Available to the public A
- Page 6 and 7:
At this very minute, with almost ab
- Page 8 and 9:
ACKNOWLEDGMENTS The Cyclops study w
- Page 10 and 11:
COMMUNICATION BY ELECTROMAGNETIC WA
- Page 12 and 13:
APPENDIX A - Astronomical Data ....
- Page 14 and 15:
t _ 2
- Page 16 and 17:
of the living beings evolved by the
- Page 18 and 19:
Figure2-1. M3I,the great galaxy in
- Page 20 and 21:
self.Thus,wecaninterpretFigure2-2as
- Page 22 and 23:
magnitude (low brightness) end, the
- Page 24 and 25:
Red Giant. The transition from main
- Page 26 and 27:
tion, as the central part of the cl
- Page 28 and 29:
TABLE 2-4 SELECTED NEARBY STARS WIT
- Page 30 and 31:
tideraisingforcesasr--_ where ,v =
- Page 32 and 33:
3. Is it possible that living syste
- Page 34 and 35:
lawsof natural selection, more like
- Page 36 and 37:
starsthroughout the Galaxyhave also
- Page 38 and 39:
if the longevity of that life is ty
- Page 40 and 41:
The imaginative reader will have no
- Page 42 and 43:
Lookingfar ahead,supposewe aresucce
- Page 44 and 45:
usuallyterritorial expansion by the
- Page 46 and 47:
IOO IO 1 [ [ J [ J I J i [ i I i I
- Page 48 and 49:
order with what Morrison has descri
- Page 50 and 51:
The quantity gtPt is often called t
- Page 52 and 53:
which might result from synchronous
- Page 54 and 55:
1. Wewillnothavenough resolving pow
- Page 56 and 57:
normalwith the meanat o x/--2. When
- Page 58 and 59:
Chapter11 in analyzingthe dataproce
- Page 60 and 61:
Therangelimitisthenfoundbyequating_
- Page 62 and 63:
TABLE 5-3 PARAMETER Wavelength Tran
- Page 64 and 65:
angeanddirectlyasthesquareof antenn
- Page 66 and 67:
"_ i i i i i p = STELLAR DENSITY AT
- Page 68 and 69:
I-- g u. O >- I--- .d tit (]O 0 0.
- Page 70 and 71:
andwidth that will still give near
- Page 72 and 73:
acquisitionphasefor otherraces.Supp
- Page 74 and 75:
1. They would transmit continuously
- Page 76 and 77:
and ¢-Ceti. No signals were detect
- Page 79 and 80:
vz .i g)mo PAGE NOr Ir[[,MZ 7. THE
- Page 81 and 82:
The price of incomplete sky coverag
- Page 83 and 84:
modest size.A largedatabaseontapeor
- Page 85 and 86:
THEAUXILIARYOPTICALSYSTEM Althoughn
- Page 88 and 89:
edetectedat 20,000light-years byCyc
- Page 90 and 91:
feeds must correct for spherical ab
- Page 92 and 93:
side of the dish and shade on the o
- Page 94 and 95:
TABLE 8-1 UNADJUSTED UNIT COST DATA
- Page 96 and 97:
7. Using huge specially designed ji
- Page 99 and 100:
9. THE RECEIVER SYSTEM The receiver
- Page 101 and 102:
whereP is the radiated power. Divid
- Page 103 and 104:
SHADOWED AREA SHADOWED AREA // // /
- Page 105 and 106:
Corrugatedhornssupportingbalancedhy
- Page 107 and 108:
o 50 ----- - _ T i 20 _,o 5 ,,,5 09
- Page 109 and 110:
TABLk ?- I A COMPARISON OF VARIOUS
- Page 111 and 112:
CENTRAL POINT STATION LSB LINE FREQ
- Page 113 and 114:
A02 .... + No (25) (i C 1 where No
- Page 115 and 116:
COAXIAL LINE DIRECTIONALCOUPLER FRE
- Page 117 and 118:
DeJager, J.T.:IEEETrans.onMicrowave
- Page 119 and 120:
pR_ING PA6E BLANK HOT FILMF_ 10. TR
- Page 121 and 122:
o-------------o_ _ o o o o ing of t
- Page 123 and 124:
addedto theother IF channel. The tw
- Page 125 and 126:
INPUT MHZ _PF 500 MHZ i : 575 T1 92
- Page 127 and 128:
azimuth _) has a delay (2a/c)sin 0
- Page 129 and 130:
stripline. For 2 _< k _< 6, appropr
- Page 131 and 132:
mation are common to all antennas i
- Page 133 and 134:
A cable pair costs about 20 cents/m
- Page 135 and 136:
11. SIGNAL PROCESSING The Cyclops s
- Page 137 and 138:
1.0 T t t I I r .9 -8 asynchronousl
- Page 139 and 140:
collimated coherent light. A simple
- Page 141 and 142:
power of the film and associated op
- Page 143 and 144:
samples simultaneously onto the sam
- Page 145 and 146:
outputs is assumed. COMPOSITE SIGNA
- Page 147 and 148:
SPECTRUM I n LINES M n LINES U SPEC
- Page 149 and 150:
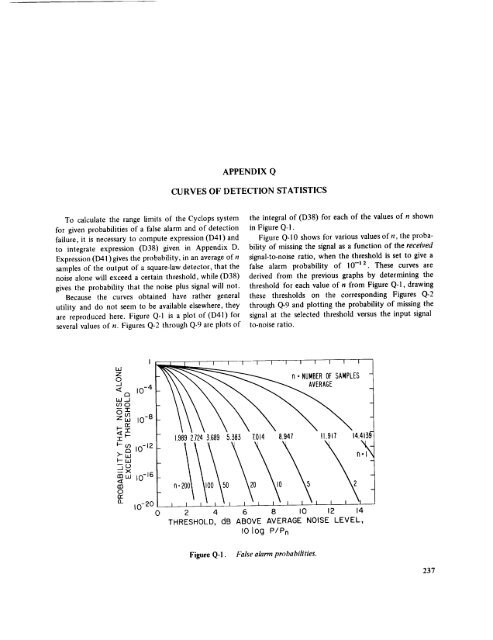
signal andyet have a tolerable fals
- Page 151 and 152:
i --_- i i i i large values of n. T
- Page 153 and 154:
plottedin Figure11-15for various va
- Page 155 and 156:
All the1Fsignalswillarrivein phasei
- Page 157 and 158:
x:(1 +x) x 2 - _ -- (53) If we wish
- Page 159 and 160:
3's = unitcostof signal planelectro
- Page 161 and 162:
where0ma x is the maximum value of
- Page 163 and 164:
Roughestimates of the costs of buil
- Page 165 and 166:
12. CYCLOPS AS A BEACON Although th
- Page 167 and 168:
13. SEARCH STRATEGY The high direct
- Page 169 and 170:
distantgalaxies (oraninertialrefere
- Page 171 and 172:
wouldfollowtheuppermost linein Figu
- Page 173 and 174:
persquaredegreeof fieldwouldberequi
- Page 175 and 176:
starsfrom/'18 to G5 could support a
- Page 177 and 178:
14. CYCLOPS AS A RESEARCH TOOL Thro
- Page 179 and 180:
Only a few such galaxies have been
- Page 181 and 182:
15. CONCLUSIONS AND RECOMMENDATIONS
- Page 183 and 184:
perhapsdecadesand possiblycenturies
- Page 185 and 186:
APPENDIX A ASTRONOMICAL DATA DISTAN
- Page 187 and 188:
PLANETARY Planet ORBITS Semimajor S
- Page 189 and 190:
APPENDIX B SUPERCIVILIZATIONS AND C
- Page 191 and 192:
ABIOLOGICAL CIVILIZATIONS Many writ
- Page 193 and 194:
182
- Page 195 and 196:
tqOT APPENDIX C OPTIMUM DETECTION A
- Page 197 and 198: to rmsnoise.Wenotethatthematchedfil
- Page 199 and 200: APPENDIX D SQUARE LAW DETECTION THE
- Page 201 and 202: If the output filter is very wide c
- Page 203 and 204: if B/2 > T we can start instead wit
- Page 205 and 206: Let us now introduce the normalized
- Page 207 and 208: where h-- = expectation count of si
- Page 209 and 210: APPENDIXE RESPONSE OF A GAUSSIAN FI
- Page 211 and 212: APPENDIXF BASE STRUCTURES AZ-EL BAS
- Page 213 and 214: ack,it shouldnotbenecessary to prov
- Page 215 and 216: 204
- Page 217 and 218: 206 i
- Page 219 and 220: PAGE BLANK NOT APPENDIX H POLARIZAT
- Page 221 and 222: APPENDIX I CASSEGRAINIAN GEOMETRY C
- Page 223 and 224: APPENDIXJ PHASINGOFTHE LOCALOSCILLA
- Page 225 and 226: APPENDIXK EFFECTOF DISPERSION IN CO
- Page 227 and 228: APPENDIX L TUNNEL AND CABLE LENGTHS
- Page 229 and 230: where r = "Ym/'rs- If we let o-_--o
- Page 231 and 232: L-4 we see that the length of IF ca
- Page 233 and 234: APPENDIX M PHASING AND TIME DELAY A
- Page 235 and 236: andobtain V = 2 (Ps [! + _(Ar)] +Pn
- Page 237 and 238: L" D 226
- Page 239 and 240: APPENDIX N SYSTEM CALIBRATION The p
- Page 241 and 242: APPENDIXO THE OPTICAL SPECTRUM ANAL
- Page 243 and 244: 232
- Page 245 and 246: APPENDIX P LUMPED CONSTANT DELAY LI
- Page 247: Thevalueofthefinalcoilonthelineis =
- Page 251 and 252: I I I I LE :E oo
- Page 253 and 254: APPENDIX R RADIO VISIBILITY OF NORM
- Page 255: io 3 - l rlrllll I I I ]l+,ll_ I _f