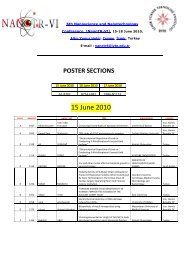
Third Day Poster Session, 17 June 2010 - NanoTR-VI
Third Day Poster Session, 17 June 2010 - NanoTR-VI
Third Day Poster Session, 17 June 2010 - NanoTR-VI

You also want an ePaper? Increase the reach of your titles
YUMPU automatically turns print PDFs into web optimized ePapers that Google loves.
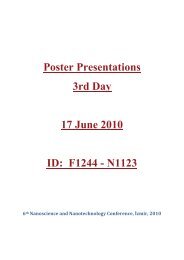
<strong>Poster</strong> <strong>Session</strong>, Thursday, <strong>June</strong> <strong>17</strong><br />
Theme F686 - N1123<br />
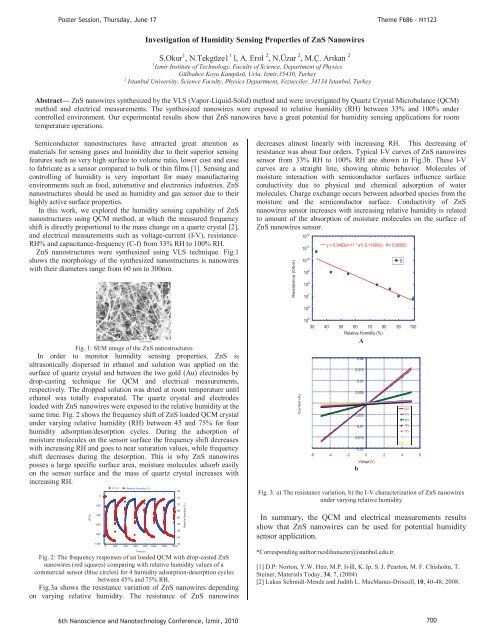
Investigation of Humidity Sensing Properties of ZnS Nanowires<br />
S.Okur 1 , N.Tekgüze1 1 l, A. Erol 2 , N.Üzar 2 , M.Ç. Arıkan 2<br />
1 Izmir Institute of Technology, Faculty of Science, Department of Physics<br />
Gülbahce Koyu Kampüsü, Urla, Izmir,35430, Turkey<br />
2 Istanbul University, Science Faculty, Physics Department, Vezneciler, 34134 Istanbul, Turkey<br />
Abstract— ZnS nanowires synthesized by the VLS (Vapor-Liquid-Solid) method and were investigated by Quartz Crystal Microbalance (QCM)<br />
method and electrical measurements. The synthesized nanowires were exposed to relative humidity (RH) between 33% and 100% under<br />
controlled environment. Our experimental results show that ZnS nanowires have a great potential for humidity sensing applications for room<br />
temperature operations.<br />
Semiconductor nanostructures have attracted great attention as<br />
materials for sensing gases and humidity due to their superior sensing<br />
features such as very high surface to volume ratio, lower cost and ease<br />
to fabricate as a sensor compared to bulk or thin films [1]. Sensing and<br />
controlling of humidity is very important for many manufacturing<br />
environments such as food, automotive and electronics industries. ZnS<br />
nanostructures should be used as humidity and gas sensor due to their<br />
highly active surface properties.<br />
In this work, we explored the humidity sensing capability of ZnS<br />
nanostructures using QCM method, at which the measured frequency<br />
shift is directly proportional to the mass change on a quartz crystal [2],<br />
and electrical measurements such as voltage-current (I-V), resistance-<br />
RH% and capacitance-frequency (C-f) from 33% RH to 100% RH.<br />
ZnS nanostructures were synthesized using VLS technique. Fig.1<br />
shows the morphology of the synthesized nanostructures is nanowires<br />
with their diameters range from 60 nm to 300nm.<br />
decreases almost linearly with increasing RH. This decreasing of<br />
resistance was about four orders. Typical I-V curves of ZnS nanowires<br />
sensor from 33% RH to 100% RH are shown in Fig.3b. These I-V<br />
curves are a straight line, showing ohmic behavior. Molecules of<br />
moisture interaction with semiconductor surfaces influence surface<br />
conductivity due to physical and chemical adsorption of water<br />
molecules. Charge exchange occurs between adsorbed species from the<br />
moisture and the semiconductor surface. Conductivity of ZnS<br />
nanowires sensor increases with increasing relative humidity is related<br />
to amount of the absorption of moisture molecules on the surface of<br />
ZnS nanowires sensor.<br />
Resistance (Ohm)<br />
10 11<br />
10 10<br />
10 9<br />
10 8<br />
10 7<br />
y = 6,9462e+11 * e^(-0,11993x) R= 0,96093<br />
B<br />
10 12 30 40 50 60 70 80 90 100<br />
10 6<br />
10 5<br />
Fig. 1: SEM image of the ZnS nanostructures<br />
In order to monitor humidity sensing properties, ZnS is<br />
ultrasonically dispersed in ethanol and solution was applied on the<br />
surface of quartz crystal and between the two gold (Au) electrodes by<br />
drop-casting technique for QCM and electrical measurements,<br />
respectively. The dropped solution was dried at room temperature until<br />
ethanol was totally evaporated. The quartz crystal and electrodes<br />
loaded with ZnS nanowires were exposed to the relative humidity at the<br />
same time. Fig. 2 shows the frequency shift of ZnS loaded QCM crystal<br />
under varying relative humidity (RH) between 45 and 75% for four<br />
humidity adsorption/desorption cycles. During the adsorption of<br />
moisture molecules on the sensor surface the frequency shift decreases<br />
with increasing RH and goes to near saturation values, while frequency<br />
shift decreases during the desorption. This is why ZnS nanowires<br />
posses a large specific surface area, moisture molecules adsorb easily<br />
on the sensor surface and the mass of quartz crystal increases with<br />
increasing RH.<br />
dF/Hz<br />
0<br />
-200<br />
-400<br />
-600<br />
-800<br />
-1000<br />
dF/Hz Relative Humidity (%)<br />
40<br />
0 200 400 600 800 1000 1200 1400<br />
Fig. 2: The frequency responses of an loaded QCM with drop-casted ZnS<br />
nanowires (red squares) comparing with relative humidity values of a<br />
commercial sensor (blue circles) for 4 humidity adsorption-desorption cycles<br />
between 45% and 75% RH.<br />
Fig.3a shows the resistance variation of ZnS nanowires depending<br />
on varying relative humidity. The resistance of ZnS nanowires<br />
Time (s)<br />
80<br />
75<br />
70<br />
65<br />
60<br />
55<br />
50<br />
45<br />
Relative Humidity (%)<br />
Current (A)<br />
Relative Humidity (%)<br />
A<br />
0,02<br />
0,015<br />
0,01<br />
0,005<br />
0<br />
-0,005<br />
-0,01<br />
-0,015<br />
100 33%<br />
-0,02<br />
-6 -4 -2 0 2 4 6<br />
b<br />
Voltage (V)<br />
Fig. 3: a) The resistance variation, b) the I-V characterization of ZnS nanowires<br />
under varying relative humidity<br />
In summary, the QCM and electrical measurements results<br />
show that ZnS nanowires can be used for potential humidity<br />
sensor application.<br />
*Corresponding author:neslihanuzar@istanbul.edu.tr.<br />
[1] D.P: Norton, Y.W. Heo, M.P. Ivill, K. Ip, S. J. Pearton, M. F. Chisholm, T.<br />
Steiner, Materials Today, 34, 7, (2004)<br />
[2] Lukas Schmidt-Mende and Judith L. MacManus-Driscoll, 10, 40-48, 2008.<br />
90% %43<br />
84% 55%<br />
75%<br />
55% 84%<br />
90% 43%<br />
100% 33%<br />
6th Nanoscience and Nanotechnology Conference, zmir, <strong>2010</strong> 700