- Page 3 and 4:
FINAL REPORTAN OCEAN BLUEPRINTFOR T
- Page 5:
THE UNITED STATES IS AN OCEAN NATIO
- Page 9 and 10:
1120 20TH STREET, NW • SUITE 200
- Page 11 and 12:
1120 20TH STREET, NW • SUITE 200
- Page 13 and 14:
1120 20TH STREET, NW • SUITE 200
- Page 15 and 16:
U.S. COMMISSION ON OCEAN POLICYChai
- Page 17 and 18:
Shirley A. Pomponi, Ph.D.President
- Page 19 and 20:
ACKNOWLEDGEMENTSAn effort of this m
- Page 22 and 23:
CHAPTER 3SETTING THE NATION’S SIG
- Page 24 and 25:
PART IVLIVING ON THE EDGE: ECONOMIC
- Page 26 and 27:
Periodic Review and Modification...
- Page 28 and 29:
Expanding Research and Education ..
- Page 30 and 31:
CHAPTER 26ACHIEVING A SUSTAINED, IN
- Page 32 and 33:
Index to the Recommendations ......
- Page 34 and 35:
LIST OF FIGURES AND TABLESFigure 1.
- Page 36 and 37:
LIST OF BOXESBox 1.1 Defining Coast
- Page 38 and 39:
PHOTOGRAPH IDENTIFICATIONAND CREDIT
- Page 40 and 41:
The Value of the Oceans and CoastsA
- Page 42 and 43:
The message from both experts and t
- Page 44 and 45:
Guiding PrinciplesThe Commi
- Page 46 and 47:
appropriate national policies, and
- Page 48 and 49:
Based on an improved understanding
- Page 50 and 51:
Figure ES.5 Many Different Platform
- Page 52 and 53:
Figure ES.6 U.S. Students Fall Behi
- Page 54 and 55:
ciated with coastal population and
- Page 56 and 57:
To ensure good coordination, the In
- Page 58 and 59:
liferation of federal and state pro
- Page 60 and 61:
Preserving Coral Reefs and Other Co
- Page 62 and 63:
pation of all ocean-related federal
- Page 64:
also produce revenues in time, and
- Page 68 and 69:
CHAPTER 1RECOGNIZING OCEAN ASSETSAN
- Page 70 and 71:
Figure 1.2 The Value of the CoastsJ
- Page 72 and 73:
Box 1.1 Defining Coastal AreasThe c
- Page 74 and 75:
Figure 1.4 The Shift from Goods to
- Page 76 and 77:
Box 1.2 The “Fourth Seacoast”
- Page 78 and 79:
chemicals tend to bind to particles
- Page 80 and 81:
coastal watershed counties grew by
- Page 82 and 83:
One of the most immediate phenomena
- Page 84 and 85:
30 Fleming, L.E., et al. “The Epi
- Page 86 and 87:
CHAPTER 2UNDERSTANDING THE PASTTO S
- Page 88 and 89:
ments. The Navy’s ocean data hold
- Page 90 and 91:
The legislation was prompted by the
- Page 92 and 93:
The architects of ocean-related pro
- Page 94 and 95:
Congress on ocean and coastal issue
- Page 96 and 97:
Figure 2.1 Invited Panelists Repres
- Page 98 and 99:
CHAPTER 3SETTING THE NATION’S SIG
- Page 100 and 101:
USCOP File PhotoThe Commiss
- Page 102 and 103:
Figure 3.1 Large Marine Ecosystems
- Page 104 and 105:
damage is also high, managers shoul
- Page 106 and 107:
Figure 3.2 The Foundations of a New
- Page 108 and 109:
PRIMER ON OCEAN JURISDICTIONS:DRAWI
- Page 110 and 111:
The Territorial Sea (0 to 12 Nautic
- Page 113 and 114:
PART 2BLUEPRINT FOR CHANGE:A NEW NA
- Page 115 and 116:
Government agencies work on these a
- Page 117 and 118:
Recommendation 4-1Congress should e
- Page 119 and 120:
• reach out to state, territorial
- Page 121 and 122:
Figure 4.2 Proposed Structure for C
- Page 123 and 124:
References1 National Research Counc
- Page 125 and 126:
significant initiative by federal a
- Page 127 and 128:
The California Bay-Delta Authority
- Page 129 and 130:
Box 5.2 Nature and Functions of Reg
- Page 131 and 132:
Box 5.3 Moving Toward Improved Fede
- Page 133 and 134:
data collection efforts are essenti
- Page 136 and 137:
CHAPTER 6COORDINATING MANAGEMENTIN
- Page 138 and 139:
nisms for managing new ocean uses.
- Page 140 and 141:
sure that disputes are resolved and
- Page 142 and 143:
Reserve System, which is made up of
- Page 144:
Regional and Local StakeholdersPart
- Page 147 and 148:
Reviewing Previous Reorganization P
- Page 149 and 150:
Box 7.1 Improving Ocean and Coastal
- Page 151 and 152:
Box 7.2 Federal Ocean and Coastal A
- Page 153 and 154:
Box 7.3 Historical Precedent for Pr
- Page 155 and 156:
Table 7.1 (continued) Thirty Years
- Page 159 and 160:
PART 3OCEAN STEWARDSHIP:THE IMPORTA
- Page 161 and 162:
Ocean StewardshipTo successfully ad
- Page 163 and 164:
Therefore, the interaction and invo
- Page 165 and 166:
NOPP’s Ocean Research Advisory Pa
- Page 167 and 168:
Recommendation 8-4Ocean.ED should d
- Page 169 and 170:
Figure 8.2 U.S. Students Fall Behin
- Page 171 and 172:
Bridging the Gap between Scientists
- Page 173 and 174:
Recommendation 8-8Ocean.ED, working
- Page 175 and 176:
creativity that has expanded our un
- Page 177 and 178:
Recommendation 8-11Ocean.ED should
- Page 179 and 180:
Recommendation 8-14The National Sci
- Page 181 and 182:
Box 8.5 What Is Informal Education?
- Page 183 and 184:
to reach desired outcomes. While fe
- Page 187 and 188:
PART 4L IVING ON THE E DGE:E CONOMI
- Page 189 and 190:
Box 9.1 Coastal Activities Are Big
- Page 191 and 192:
state and local decision making, so
- Page 193 and 194:
• goals—State coastal managemen
- Page 195 and 196:
Other Relevant Federal ProgramsIn a
- Page 197 and 198:
forward. An applicant can appeal su
- Page 199 and 200:
References1 Culliton, T.J. Populati
- Page 201 and 202:
Improving Federal Managementof Haza
- Page 203 and 204:
Box 10.2 New Orleans at RiskPrior t
- Page 205 and 206:
Dave Gatley/FEMA News PhotoHomes bu
- Page 207 and 208:
that develop excellent mitigation p
- Page 209 and 210:
tal and human disturbances such as
- Page 211 and 212:
PhotolinkCoastal habitats provide e
- Page 213 and 214:
Restoration efforts have intensifie
- Page 215 and 216:
Box 11.2 A Community Habitat Restor
- Page 217 and 218:
Although it has shown some success
- Page 219 and 220:
Box 12.1 Sediment: Friend or Foe?Se
- Page 221 and 222:
Changing Sediment QualityOver the l
- Page 223 and 224:
One of the difficulties in undertak
- Page 225 and 226:
Beneficial Uses of Dredged Material
- Page 227 and 228:
The National Shoreline Management S
- Page 230 and 231:
CHAPTER 13SUPPORTING MARINE COMMERC
- Page 232 and 233:
Figure 13.1 Ports Are the Primary G
- Page 234 and 235:
Harbors, Channels, and WaterwaysThe
- Page 236 and 237:
Recommendation 13-2Congress should
- Page 238 and 239:
Recommendation 13-5The U.S. Departm
- Page 241 and 242:
PART VC LEAR WATERS A HEAD:C OASTAL
- Page 243 and 244:
Figure 14.1 Report Card on Regional
- Page 245 and 246:
sources, such as industrial facilit
- Page 247 and 248:
meet water quality goals. Decisions
- Page 249 and 250:
Animal Feeding OperationsMany anima
- Page 251 and 252:
nants over land, into streams and g
- Page 253 and 254:
Major Nonpoint SourcesThe majority
- Page 255 and 256:
USCOP File PhotoUSCOP File PhotoAs
- Page 257 and 258:
Expanding Uses of State Revolving F
- Page 259 and 260:
Recommendation 14-11The U.S. Enviro
- Page 261 and 262:
assisting in the implementation of
- Page 263 and 264:
References1 U.S. Environmental Prot
- Page 265 and 266:
Box 15.1 Ocean and Coastal Monitori
- Page 267 and 268:
EPA’s Environmental Monitoring an
- Page 269 and 270:
local, and municipal governments, w
- Page 271 and 272:
System DesignSampling protocols are
- Page 273 and 274:
Making Data Accessible and UsefulA
- Page 275 and 276:
and 75 percent of cargo ships opera
- Page 277 and 278:
Although many flag states take thei
- Page 279 and 280:
Reducing Vessel PollutionStrengthen
- Page 281 and 282:
Recommendation 16-5Congress should
- Page 283 and 284:
Voluntary actions can provide a use
- Page 285 and 286:
Figure 16.2 The Oil Pollution Act C
- Page 287 and 288:
developing new regulatory and non-r
- Page 289 and 290:
25 Ibid.26 Center for Environmental
- Page 291 and 292:
Box 17.1 What Is an Invasive Specie
- Page 293 and 294:
Figure 17.2 Addressing Aquatic Inva
- Page 295 and 296:
Global Trade in Marine OrganismsHum
- Page 297 and 298:
Recommendation 17-4The National Oce
- Page 299 and 300:
tant for ballast water, coordinated
- Page 301 and 302:
10 U.S. General Accounting Office.
- Page 303 and 304:
each in the entire world. 3 A study
- Page 305 and 306:
Research Program), directed by NOAA
- Page 307 and 308:
established simply on the basis of
- Page 309:
References1 U.S. Department of Comm
- Page 312 and 313:
CHAPTER 19ACHIEVING SUSTAINABLEFISH
- Page 314 and 315:
Figure 19.1 Fishery LitigationGrows
- Page 316 and 317:
While determining allowable biologi
- Page 318 and 319:
Although the Secretary of Commerce
- Page 320 and 321:
platforms to expand the scope of da
- Page 322 and 323:
Figure 19.3 Migratory Fish RequireC
- Page 324 and 325:
majority of RFMC members, may tend
- Page 326 and 327:
entrants to a fishery. However, the
- Page 328 and 329:
Recommendation 19-15Congress should
- Page 330 and 331:
NOAA Photo LibraryEnforcement Partn
- Page 332 and 333:
The cost of VMS for fishing vessel
- Page 334 and 335:
Ecosystem-based management will als
- Page 336 and 337:
Recommendation 19-21The National Ma
- Page 338 and 339:
• Major government subsidies aime
- Page 340 and 341:
oad regions of the seas, the existi
- Page 342:
References1 U.S. Commission
- Page 345 and 346:
fishing line because they are not a
- Page 347 and 348:
Reviewing Authorities and Responsib
- Page 349 and 350:
The division of endangered species
- Page 351 and 352:
PhotolinkHumans love to observe mar
- Page 353 and 354:
Although not always caused by human
- Page 355 and 356:
Box 20.1 Making a Case for Ecosyste
- Page 357 and 358:
9 Flint, E. and Swift, K. eds. Seco
- Page 359 and 360:
Figure 21.1 Tropical Waters Are Hom
- Page 361 and 362:
appear to be exacerbating other cor
- Page 363 and 364:
task force are the U.S. Department
- Page 365 and 366:
exploitation by strictly regulating
- Page 368 and 369:
CHAPTER 22SETTING A COURSE FORSUSTA
- Page 370 and 371:
which are widespread in European sa
- Page 372 and 373:
cies, and provides recommendations
- Page 374:
Promoting International Improvement
- Page 377 and 378:
tissues of fish and shellfish. When
- Page 379 and 380:
Box 23.1 Special Focus on Microbial
- Page 381 and 382:
Recommendation 23-1The National Oce
- Page 383 and 384:
Figure 23.1 Harmful Algal Blooms on
- Page 385 and 386:
waters used for drinking and public
- Page 387 and 388:
The FDA is responsible for ensuring
- Page 389 and 390:
Recommendation 23-5The National Oce
- Page 391 and 392:
over control of offshore waters. On
- Page 393 and 394:
Figure 24.1 Offshore Oil and Gas Le
- Page 395 and 396:
Trends in Domestic Offshore Oil and
- Page 397 and 398:
Table 24.1 Federal Revenues from Of
- Page 399 and 400:
State Involvement in OCS Oil and Ga
- Page 401 and 402:
Figure 24.3 Oil Inputs to theNorth
- Page 403 and 404:
The estimated amount of natural gas
- Page 405 and 406:
Box 24.3 A Mighty Wind Blows in Cap
- Page 407 and 408:
commercial recovery, including offs
- Page 411 and 412:
PART VIIS CIENCE- BASED D ECISIONS:
- Page 413 and 414:
hydrologic, and atmospheric systems
- Page 415 and 416:
down about one-half of the highly-r
- Page 417 and 418:
ocean temperature can put the healt
- Page 419 and 420:
Natural Hazards• basic understand
- Page 421 and 422:
ating valuable information, includi
- Page 423 and 424:
The National Sea Grant College Prog
- Page 425 and 426:
The Value of Ocean ExplorationAbout
- Page 427 and 428:
Box 25.2 Primary Federal Agencies t
- Page 429 and 430:
Recommendation 25-7The Federal Geog
- Page 432 and 433:
CHAPTER 26ACHIEVING A SUSTAINED,INT
- Page 434 and 435:
An integrated ocean and coastal obs
- Page 436 and 437:
nation’s coastal and marine resou
- Page 438 and 439:
One obvious application of the obse
- Page 440 and 441:
Recommendation 26-5Ocean.US should
- Page 442 and 443:
Recommendation 26-7Ocean.US should
- Page 444 and 445:
Box 26.3 The National Weather Servi
- Page 446 and 447:
Box 26.4 An Investment with Big Ret
- Page 448:
Islands, and Palau). Examples of ca
- Page 451 and 452:
This chapter does not attempt to pr
- Page 453 and 454:
Furthermore, while some facilities
- Page 455 and 456:
University of Hawaii Marine CenterT
- Page 457 and 458:
cost of approximately $5 million; a
- Page 459 and 460:
communication capabilities are also
- Page 461 and 462:
A Coast Guard cutter and helicopter
- Page 463 and 464:
surface temperature measurements, a
- Page 465 and 466:
References1 Office of Technology As
- Page 467 and 468:
Box 28.1 Data Management Terminolog
- Page 469 and 470:
to gather and integrate data from s
- Page 471 and 472:
Figure 28.2 The Growing Demand for
- Page 473 and 474:
• coordinate federal agency effor
- Page 475 and 476:
Recommendation 28-3Ocean.IT should
- Page 479 and 480:
PART VIIITHE GLOBAL OCEAN:U.S. PART
- Page 481 and 482:
intergovernmental cooperation, and
- Page 483 and 484:
the LOS Convention are in the proce
- Page 485 and 486:
Table 29.1 (continued) U.S. Partici
- Page 487 and 488:
Meeting International ObligationsAl
- Page 489 and 490:
Box 29.1 Selected International Bod
- Page 491 and 492:
International Ocean Science Program
- Page 493:
Box 29.2 U.S. Involvement in Intern
- Page 496 and 497:
CHAPTER 30FUNDING NEEDS ANDPOSSIBLE
- Page 498 and 499:
Table 30.1 Summary of Costs Associa
- Page 500 and 501:
Table 30.1 (continued) Summary of C
- Page 502 and 503:
also require federal support to bec
- Page 504 and 505:
Other Ocean and Coastal Management
- Page 506 and 507:
Chapter 24 also addresses the poten
- Page 508:
Nevertheless, the need remains for
- Page 511 and 512:
• Multiple Use Management: The ma
- Page 513 and 514:
Index to the RecommendationsThe fol
- Page 515 and 516:
Department of DefenseArmy Corps of
- Page 517 and 518:
Recommendations to Regional BodiesR
- Page 519 and 520:
• expand education and outreach e
- Page 521 and 522:
Chapter 5: Advancing a Regional App
- Page 523 and 524:
Chapter 7: Strengthening the Federa
- Page 525 and 526:
• expanding the reach of each cen
- Page 527 and 528:
Recommendation 8-15The Office of Na
- Page 529 and 530:
Recommendation 10-2The National Oce
- Page 531 and 532:
Recommendation 12-4The National Dre
- Page 533 and 534: Chapter 14: Addressing Coastal Wate
- Page 535 and 536: Recommendation 14-12The U.S. Enviro
- Page 537 and 538: Recommendation 16-6The U.S. Environ
- Page 539 and 540: Recommendation 17-5The National Inv
- Page 541 and 542: • the National Oceanic and Atmosp
- Page 543 and 544: Recommendation 19-12Congress should
- Page 545 and 546: Recommendation 19-21The National Ma
- Page 547 and 548: Recommendation 20-7The National Oce
- Page 549 and 550: Chapter 22: Setting a Course for Su
- Page 551 and 552: • work with the National Ocean Co
- Page 553 and 554: • an interagency steering group,
- Page 555 and 556: Recommendation 26-6The National Oce
- Page 557 and 558: Recommendation 27-4Congress should
- Page 559 and 560: Chapter 29: Advancing International
- Page 563: PART XA PPENDICESAPPENDIX AOCEANS A
- Page 566 and 567: One Hundred Sixth CongressOf theUni
- Page 568 and 569: (e) MEETINGS—(1) ADMINISTRATION
- Page 570 and 571: Section 5. Biennial ReportBeginning
- Page 572 and 573: ACRONYMS APPEARING IN THE REPORTAAA
- Page 575 and 576: APPENDIX CLIVING NEAR…AND MAKINGA
- Page 577 and 578: growing much faster. The region nea
- Page 579 and 580: 2. DEFINING THE COASTWhat is meant
- Page 581 and 582: almost doubled in population over t
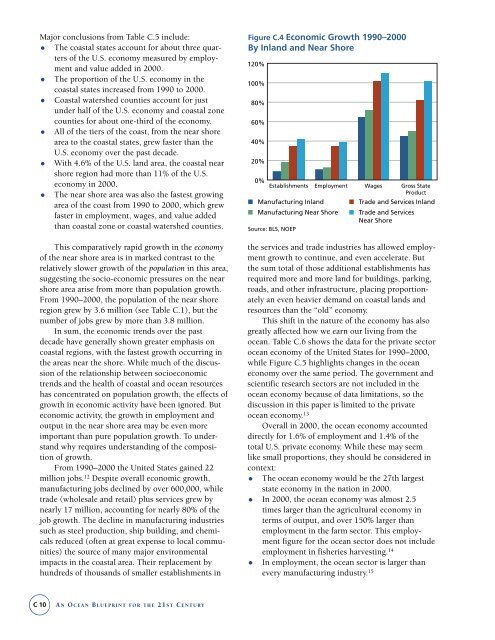
- Page 583: 4. THE COASTAL AND OCEANECONOMY OF
- Page 587 and 588: Figure C.7 Regional Distribution of
- Page 589 and 590: 5. THE COASTAL AND OCEANECONOMY BEY
- Page 591 and 592: 6. IMPLICATIONSThe changes in the c
- Page 593 and 594: 7. THE FUTURE OF UNDERSTANDINGTHE C
- Page 595 and 596: Table C.1 Population Change in the
- Page 597 and 598: Table C.4 Population Growth by Coas
- Page 599 and 600: REFERENCESApogee Research and Resou
- Page 601: NOTES1 “Counties” in this conte
- Page 604 and 605: SECTION 3OCEAN AND COASTAL-RELATED
- Page 606 and 607: SECTION 1PURPOSE OF THIS GLOSSARYTh
- Page 608 and 609: Council on Environmental QualityCre
- Page 610 and 611: SECTION 3OCEAN AND COASTAL-RELATEDF
- Page 612 and 613: Comprehensive Environmental Respons
- Page 614 and 615: Marine Plastic Pollution Researchan
- Page 616 and 617: Outer Continental Shelf Lands ActTh
- Page 618 and 619: Clean Water Act—National EstuaryP
- Page 620 and 621: Farm Bill Conservation ProgramsCong
- Page 623: APPENDIX EP ROPOSED S TRUCTURE FORC
- Page 627 and 628: APPENDIX FC ONGRESSIONAL C OMMITTEE
- Page 629 and 630: Table F.1 Congressional Committees
- Page 631: Committee on Transportation and Inf
- Page 634 and 635:
Detailed Costs Associated with Reco
- Page 636 and 637:
Detailed Costs Associated with Reco
- Page 638 and 639:
Detailed Costs Associated with Reco
- Page 640 and 641:
Detailed Costs Associated with Reco
- Page 642 and 643:
Detailed Costs Associated with Reco
- Page 644 and 645:
Detailed Costs Associated with Reco
- Page 646 and 647:
INDEXacademic/academia, 260aquacult
- Page 648 and 649:
federal area-based programs,34, 150
- Page 650 and 651:
integration of multiplesources, 234
- Page 652 and 653:
programmatic permitting,312-314prot
- Page 654 and 655:
coordination and cooperationin, 100
- Page 656 and 657:
Department of Educationinitiative,
- Page 658 and 659:
invasive species, 252-263aquacultur
- Page 660 and 661:
common heritage of mankind,53deep s
- Page 662 and 663:
monitoring programs, 228,230, 231,
- Page 664 and 665:
jurisdiction issues, 72, 454nationa
- Page 666 and 667:
Mid-Atlantic, 276, 278, 288mission,
- Page 668 and 669:
single-hull vessel phase-outs,54, 2
- Page 670 and 671:
Service, 215, 260Economic Research
- Page 672:
pharmaceuticals and antibiotics,209


