2009 Scenario Reliability Assessment - NERC
2009 Scenario Reliability Assessment - NERC
2009 Scenario Reliability Assessment - NERC
- No tags were found...

You also want an ePaper? Increase the reach of your titles
YUMPU automatically turns print PDFs into web optimized ePapers that Google loves.
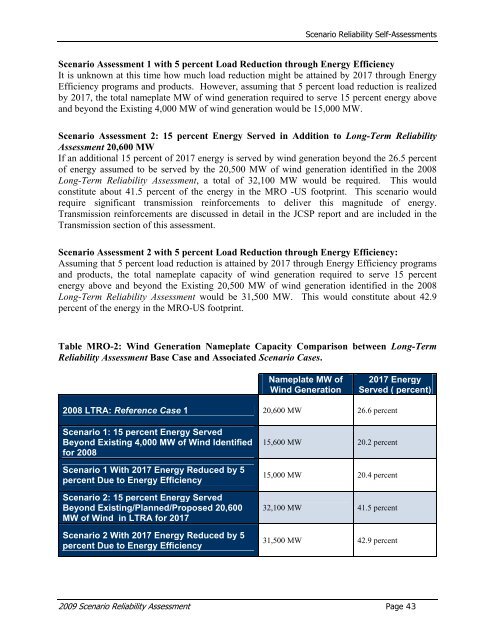
<strong>Scenario</strong> <strong>Reliability</strong> Self-<strong>Assessment</strong>s<strong>Scenario</strong> <strong>Assessment</strong> 1 with 5 percent Load Reduction through Energy EfficiencyIt is unknown at this time how much load reduction might be attained by 2017 through EnergyEfficiency programs and products. However, assuming that 5 percent load reduction is realizedby 2017, the total nameplate MW of wind generation required to serve 15 percent energy aboveand beyond the Existing 4,000 MW of wind generation would be 15,000 MW.<strong>Scenario</strong> <strong>Assessment</strong> 2: 15 percent Energy Served in Addition to Long-Term <strong>Reliability</strong><strong>Assessment</strong> 20,600 MWIf an additional 15 percent of 2017 energy is served by wind generation beyond the 26.5 percentof energy assumed to be served by the 20,500 MW of wind generation identified in the 2008Long-Term <strong>Reliability</strong> <strong>Assessment</strong>, a total of 32,100 MW would be required. This wouldconstitute about 41.5 percent of the energy in the MRO -US footprint. This scenario wouldrequire significant transmission reinforcements to deliver this magnitude of energy.Transmission reinforcements are discussed in detail in the JCSP report and are included in theTransmission section of this assessment.<strong>Scenario</strong> <strong>Assessment</strong> 2 with 5 percent Load Reduction through Energy Efficiency:Assuming that 5 percent load reduction is attained by 2017 through Energy Efficiency programsand products, the total nameplate capacity of wind generation required to serve 15 percentenergy above and beyond the Existing 20,500 MW of wind generation identified in the 2008Long-Term <strong>Reliability</strong> <strong>Assessment</strong> would be 31,500 MW. This would constitute about 42.9percent of the energy in the MRO-US footprint.Table MRO-2: Wind Generation Nameplate Capacity Comparison between Long-Term<strong>Reliability</strong> <strong>Assessment</strong> Base Case and Associated <strong>Scenario</strong> Cases.Nameplate MW ofWind Generation2017 EnergyServed ( percent)2008 LTRA: Reference Case 1 20,600 MW 26.6 percent<strong>Scenario</strong> 1: 15 percent Energy ServedBeyond Existing 4,000 MW of Wind Identifiedfor 2008<strong>Scenario</strong> 1 With 2017 Energy Reduced by 5percent Due to Energy Efficiency<strong>Scenario</strong> 2: 15 percent Energy ServedBeyond Existing/Planned/Proposed 20,600MW of Wind in LTRA for 2017<strong>Scenario</strong> 2 With 2017 Energy Reduced by 5percent Due to Energy Efficiency15,600 MW 20.2 percent15,000 MW 20.4 percent32,100 MW 41.5 percent31,500 MW 42.9 percent<strong>2009</strong> <strong>Scenario</strong> <strong>Reliability</strong> <strong>Assessment</strong> Page 43