- Page 1 and 2:
Post Flight Analysis — Final Repo
- Page 3 and 4:
Signatures & ApprovalsPrepared byPu
- Page 5 and 6:
Table of ContentsPreface . . . . .
- Page 8 and 9:
6.8 Sources and References . . . .
- Page 10 and 11:
11 Telescope Readout Subsystem (TRE
- Page 12 and 13:
14 Data Collection, Processing & An
- Page 14 and 15:
xiv March 2007 Table of Contents
- Page 16 and 17:
Figure 3-4. The GP-B dewar—one of
- Page 18 and 19:
Figure 8-5. The Seasons of GP-B . .
- Page 20 and 21:
Figure 11-20. Pointing angle differ
- Page 22 and 23:
Figure 14-9. In the Anomaly Room, t
- Page 24 and 25:
xxiv March 2007
- Page 26 and 27:
Table 13-3. GP-B payload magnetomet
- Page 28 and 29:
xxviiiMarch 2007
- Page 30 and 31:
2 March 2007 Chapter 1 — Executiv
- Page 32 and 33:
facility, it was necessary to recas
- Page 34 and 35:
spacetime around with them as they
- Page 36 and 37:
After years of work and the inventi
- Page 38 and 39:
axis of a gyroscope rotor changes i
- Page 40 and 41:
Figure 1-8. Clockwise, from top lef
- Page 42 and 43:
“management experiment.” This w
- Page 44 and 45:
Attitude-Control Gyroscopes. Two pa
- Page 46 and 47:
Any significant deviation from “g
- Page 48 and 49:
established, ranging from Level 1 (
- Page 50 and 51:
1.14 The Broader Legacy of GP-BAt l
- Page 52 and 53:
24 March 2007 Chapter 2 — Overvie
- Page 54 and 55:
Figure 2-1. GP-B Historical Time Li
- Page 56 and 57:
Applied Physics Laboratory, of the
- Page 58 and 59:
William Fairbank once remarked: “
- Page 60 and 61:
In Einstein’s view, space and tim
- Page 62 and 63:
y a mere 1.1 inches. You can see th
- Page 64 and 65:
Figure 2-10. Schematic diagram of t
- Page 66 and 67:
Figure 2-12. Final assembly of the
- Page 68 and 69:
Sun Shield. The sun shield is a lon
- Page 70 and 71:
2.1.8 The Broader Legacy of GP-BWhe
- Page 72 and 73:
2.3 Spacecraft SeparationThe Solar
- Page 74 and 75:
Flight Anomalies.) Furthermore, a d
- Page 76 and 77:
Table 2-2. Weekly summary of IOC ac
- Page 78 and 79:
2.4.3.2 Guide Star AcquisitionAbout
- Page 80 and 81:
A second mass trim operation had be
- Page 82 and 83:
On Friday, 2 July 2004, the spin ra
- Page 84 and 85:
Low temperature bakeout was first p
- Page 86 and 87:
2.5.1.3 Lockheed Martin Team Phase-
- Page 88 and 89:
Monthly Highlights of the GP-B Scie
- Page 90 and 91:
2.6.1 Overview of the Calibration P
- Page 92 and 93:
Weekly Highlights of the GP-B Final
- Page 94 and 95:
66 March 2007 Chapter 3 — Accompl
- Page 96 and 97:
It was in this pristine, near-zero
- Page 98 and 99:
Each quartz rotor is coated with a
- Page 100 and 101:
Figure 3-3. Functional diagram of a
- Page 102 and 103:
Based on data from the on-board tel
- Page 104 and 105:
Ideally, the telescope should have
- Page 106 and 107:
Figure 3-9. Schematic diagram of st
- Page 108 and 109:
used. The star trackers are essenti
- Page 110 and 111:
Result: By using the porous plug, w
- Page 112 and 113:
Solution: Create a tetrahedral lapp
- Page 114 and 115:
Constraint 2: The exhaust tube must
- Page 116 and 117:
Result: The on-orbit gyroscope spin
- Page 118 and 119:
spacecraft's subsystems for the dur
- Page 120 and 121:
Constraint 3: Keep the spacecraft p
- Page 122 and 123:
Technology Category Specific Implem
- Page 124 and 125:
96 March 2007 Chapter 4 — GP-B On
- Page 126 and 127:
Any significant deviation from “g
- Page 128 and 129:
packages, one for each Ping load an
- Page 130 and 131:
In addition to these software packa
- Page 132 and 133:
Table 4-6. Features & benefits of W
- Page 134 and 135:
This software added considerable ef
- Page 136 and 137:
It is said that “an experiment is
- Page 138 and 139:
Table 4-10. Significant Events/Sour
- Page 140 and 141:
Figure 4-5. Pictorial depiction of
- Page 142 and 143:
Figure 4-7. Eta-Average Error Assoc
- Page 144 and 145:
4.4.4.2 OD Using SLR DataFigure 4-9
- Page 146 and 147:
4.4.5 ConclusionsFigure 4-11. Compa
- Page 148 and 149:
Overall, the storage issues did not
- Page 150 and 151:
Table 4-11. ITF equipment listEQUIP
- Page 152 and 153:
124 March 2007 Chapter 5 — Managi
- Page 154 and 155:
5.2 Overview of GP-B Anomalies in O
- Page 156 and 157:
Figure 5-1. Anomaly Review Team Org
- Page 158 and 159:
5.3.3.1 Anomaly Investigation and R
- Page 160 and 161:
5.3.5 Anomaly Identification and Re
- Page 162 and 163:
5.4.3 Risk Management ApproachThe r
- Page 164 and 165:
Table 5-1. Summary of Open GP-B ris
- Page 166 and 167:
138 March 2007 Chapter 5 — Managi
- Page 168 and 169:
140 March 2007 Chapter 6 — The GP
- Page 170 and 171:
3. Payload Integration, Testing and
- Page 172 and 173:
Figure 6-1. Clockwise from top left
- Page 174 and 175:
MSFC conducted an in-house Phase A
- Page 176 and 177:
It is important to note that from t
- Page 178 and 179:
6.3.1 Incremental PrototypingThe pe
- Page 180 and 181:
alignment, and act as an accelerome
- Page 182 and 183:
Figure 6-9. The Lockheed Martin GP-
- Page 184 and 185:
Furthermore, a fourth electronic sy
- Page 186 and 187:
positive thermal connections betwee
- Page 188 and 189:
astrophysics/cosmology. Many of the
- Page 190 and 191:
Figure 6-10. MSFC Program Managers/
- Page 192 and 193:
As described in Chapter 2, the flig
- Page 194 and 195:
6.7 Some Observations on the Manage
- Page 196 and 197:
168 March 2007 Chapter 6 — The GP
- Page 198 and 199:
170 March 2007 Chapter 7 — Attitu
- Page 200 and 201:
7.1.2 Vehicle ATC ModesThere are es
- Page 202 and 203:
The output of the pressure transduc
- Page 204 and 205:
Figure 7-3. Science Telescope Compo
- Page 206 and 207:
Figure 7-5. Pitch and Yaw Pointing
- Page 208 and 209:
Figure 7-7. Magnitude of the roll r
- Page 210 and 211:
Changing the method by which the gy
- Page 212 and 213:
7.3.3 Drag-Free Control SystemFigur
- Page 214 and 215:
7.3.3.1 DFS - PerformanceThe GP-B d
- Page 216 and 217:
Figure 7-15. Mass flow effects of a
- Page 218 and 219:
7.5.2 Successful recovery from mult
- Page 220 and 221:
If the vehicle control system were
- Page 222 and 223:
accomplish this, the ARPs are mount
- Page 224 and 225:
7.5.6.1 South Atlantic AnomalyProto
- Page 226 and 227:
Figure 7-23. Effects on telescope p
- Page 228 and 229:
200 March 2007 Chapter 7 — Attitu
- Page 230 and 231:
202 March 2007 Chapter 8 — Other
- Page 232 and 233:
Figure 8-2. Block Diagram of CDH co
- Page 234 and 235:
8.1.1.4 WATCH DOG TIMERFigure 8-4.
- Page 236 and 237:
of eclipses each day (approximately
- Page 238 and 239:
Figure 8-8. GSS1 Temperature Trends
- Page 240 and 241:
Figure 8-10. Forward Dewar Vacuum S
- Page 242 and 243:
The Gravity Probe B spacecraft has
- Page 244 and 245:
Figure 8-13. Forward -X Thruster Te
- Page 246 and 247:
gaFigure 8-15. Aft -X Thruster Temp
- Page 248 and 249:
Because there are only two SQUID br
- Page 250 and 251:
Because the specifications for SRE
- Page 252 and 253:
8.3.2 Critical Mission RequirementT
- Page 254 and 255:
Figure 8-19 is a plot of the power
- Page 256 and 257:
Battery Performance Summary:Figure
- Page 258 and 259:
Figure 8-23. Solar Array Temperatur
- Page 260 and 261:
8.3.10 ConclusionThe electrical pow
- Page 262 and 263:
8.4.1 TDRSS OperationsFigure 8-28.
- Page 264 and 265:
Figure 8-30. Xpndr-A STDN (green),
- Page 266 and 267:
Figure 8-32. Plot of TDRS AGC vs Te
- Page 268 and 269:
The FSW also met its subsystem leve
- Page 270 and 271:
Appendix E, Flight Software Applica
- Page 272 and 273:
Table 8-4. SCRs Addressed in On-orb
- Page 274 and 275:
The software and macro changes resu
- Page 276 and 277:
Figure 8-38 below is an excerpt fro
- Page 278 and 279:
Figure 8-40. A-side CCCA Single Bit
- Page 280 and 281:
Figure 8-43. A-side CCCA Single Bit
- Page 282 and 283:
When single MBEs did not result in
- Page 284 and 285:
256 March 2007 Chapter 9 — Gyro S
- Page 286 and 287:
9.1 GSS Hardware DescriptionFigure
- Page 288 and 289:
significantly reduces and thus pres
- Page 290 and 291:
9.1.11 Clock synchronizationThe aft
- Page 292 and 293:
Figure 9-8. Block diagram of the LQ
- Page 294 and 295:
direction (transverse to the space
- Page 296 and 297:
9.2.2.2 Spin-up SuspensionDuring sp
- Page 298 and 299:
Figure 9-16. Predicted and measured
- Page 300 and 301:
Figure 9-18. The GSS passes rotor c
- Page 302 and 303:
Figure 9-20. Representative drag-fr
- Page 304 and 305:
Table 9-1. GSS Science Mission Mode
- Page 306 and 307:
Table 9-3. GSW application source l
- Page 308 and 309:
The Design and Testing of the Gravi
- Page 310 and 311:
282 March 2007 Chapter 10 — SQUID
- Page 312 and 313:
ate uncertainty). Although we have
- Page 314 and 315:
All of the GP-B electronics have be
- Page 316 and 317:
10.3 Pre-Launch Ground-Based TestsW
- Page 318 and 319:
Figure 10-6. AC Magnetic Shielding
- Page 320 and 321:
Figure 10-8. Temperature Error of S
- Page 322 and 323:
Figure 10-10. Quiescent SQUID Noise
- Page 324 and 325:
Analog control loops on the electro
- Page 326 and 327:
The science support applications ru
- Page 328 and 329:
Table 10-7. SSW application source
- Page 330 and 331:
Table 10-7. SSW application source
- Page 332 and 333:
Table 10-7. SSW application source
- Page 334 and 335:
Table 10-7. SSW application source
- Page 336 and 337:
308 March 2007 Chapter 11 — Teles
- Page 338 and 339:
Figure 11-1. Block diagram of TRE a
- Page 340 and 341:
Additionally, the warm electronics
- Page 342 and 343:
Figure 11-3. CLL switch states duri
- Page 344 and 345:
Table 11-3. Dates and UTC times whe
- Page 346 and 347:
Figure 11-7. Low Gamma Angle Data S
- Page 348 and 349: s N+w i= sign+w i++−+−w i−w i
- Page 350 and 351: expression, which otherwise on a po
- Page 352 and 353: Figure 11-14. Y axis, B side RMS po
- Page 354 and 355: Figure 11-17. X axis, B side curren
- Page 356 and 357: Figure 11-20. Pointing angle differ
- Page 358 and 359: Figure 11-24. Scaled summed current
- Page 360 and 361: Figure 11-26 through Figure 11-29 s
- Page 362 and 363: 334 March 2007 Chapter 12 — Cryog
- Page 364 and 365: 12.2 Temperature / pressure control
- Page 366 and 367: control the space vehicle without t
- Page 368 and 369: Figure 12-3. Helium flow rate predi
- Page 370 and 371: helium at 1.8 K. It does not appear
- Page 372 and 373: Figure 12-6. Flow meter and ATC flo
- Page 374 and 375: were generally within a day or so o
- Page 376 and 377: shields) and subsequent instability
- Page 378 and 379: 350 March 2007 Chapter 12 — Cryog
- Page 380 and 381: 352 March 2007 Chapter 13 — Other
- Page 382 and 383: Figure 13-2. ECU-operated heaters i
- Page 384 and 385: 13.1.3.1 Vatterfly Valve Operations
- Page 386 and 387: 13.1.3.7 Payload MagnetometersThe E
- Page 388 and 389: Figure 13-11. ECU performance durin
- Page 390 and 391: As we entered the second month of o
- Page 392 and 393: During the last month of IOC, prepa
- Page 394 and 395: Figure 13-19. ECU heater activity d
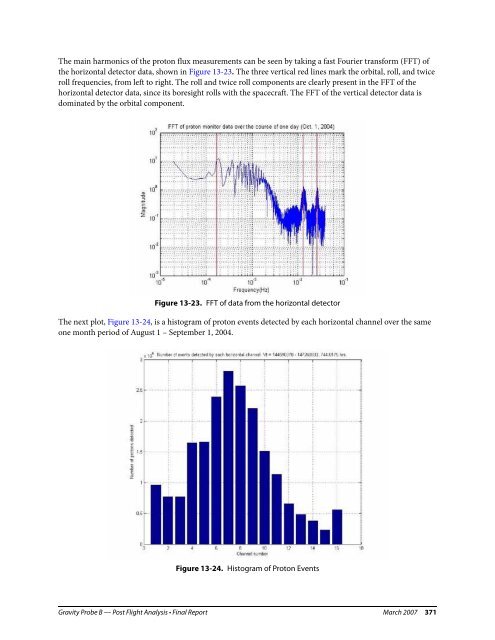
- Page 396 and 397: Table 13-1. Proton monitor channel
- Page 400 and 401: In November, 2004 there was a large
- Page 402 and 403: Figure 13-28 shows a correlation th
- Page 404 and 405: 13.3.1 About the MagnetometersFigur
- Page 406 and 407: 13.3.2 Other Applications for Paylo
- Page 408 and 409: Figure 13-35. GPS Antennae Field of
- Page 410 and 411: Figure 13-37. Master Antenna Switch
- Page 412 and 413: Figure 13-39. Time difference betwe
- Page 414 and 415: 13.4.6 On-Orbit ResultsThe GPS comp
- Page 416 and 417: and velocity values erroneously cal
- Page 418 and 419: E. G. Lightsey, C. E. Cohen, B. W.
- Page 420 and 421: Figure 13-45. A Bottom View of the
- Page 422 and 423: Figure 13-48. The GMA configuration
- Page 424 and 425: Table 13-10. Summary for Helium Gas
- Page 426 and 427: 398 March 2007 Chapter 14 — Data
- Page 428 and 429: a relatively slow data rate, so we
- Page 430 and 431: Figure 14-4. NASA ground stations a
- Page 432 and 433: electronic components to recover fr
- Page 434 and 435: By a process of elimination, the GP
- Page 436 and 437: A special room in the GP-B Mission
- Page 438 and 439: Starting on 3 December 1725, Bradle
- Page 440 and 441: seemed that aberration of starlight
- Page 442 and 443: 14.1.6 Telescope Dither—Correlati
- Page 444 and 445: 14.1.6.3 The Telescope Dither Patte
- Page 446 and 447: amplifications. Thus, in addition t
- Page 448 and 449:
14.2.2 Independent Data Analysis Te
- Page 450 and 451:
monthly time scales. Though only sh
- Page 452 and 453:
424 March 2007 Chapter 15 — Preli
- Page 454 and 455:
Figure 15-2. A diagram of the GP-B
- Page 456 and 457:
15.4 The Two Surprises and Their Im
- Page 458 and 459:
Near Zeroes.) The exception that we
- Page 460 and 461:
Figure 15-8. A slide from the GP-B
- Page 462 and 463:
Figure 15-9. A poster on the effect
- Page 464 and 465:
electrostatic patches, located at o
- Page 466 and 467:
Last summer (2006), Mac Keiser devi
- Page 468 and 469:
440 March 2007 Chapter 15 — Preli
- Page 470 and 471:
442 March 2007 Chapter 16 — Lesso
- Page 472 and 473:
16.1.1.3 Flight science downlink da
- Page 474 and 475:
Description of the GP-B experience:
- Page 476 and 477:
Lessons:1. Perform all tests with a
- Page 478 and 479:
Description of the GP-B experience:
- Page 480 and 481:
Figure 16-1. Six interacting transl
- Page 482 and 483:
16.1.3.2 Training and certification
- Page 484 and 485:
Description of the GP-B experience:
- Page 486 and 487:
Below is an edited summary of six a
- Page 488 and 489:
460 March 2007 Chapter 16 — Lesso
- Page 490 and 491:
462 March 2007 Appendix A — Gravi
- Page 492 and 493:
Apogee altitude659.1 km (409.6 mile
- Page 494 and 495:
466 March 2007 Chapter B — Spacec
- Page 496 and 497:
Gravity Probe B — Post Flight Ana
- Page 498 and 499:
470 March 2007 Appendix C — Weekl
- Page 500 and 501:
16 April 2004—Vehicle is Prepared
- Page 502 and 503:
The electrical power system is full
- Page 504 and 505:
4 JUNE 2004—MISSION UPDATE: DAY 4
- Page 506 and 507:
SQUIDs to detect their rotation spe
- Page 508 and 509:
17 JULY 2004—MISSION UPDATE: DAY
- Page 510 and 511:
indicate that we have reduced the t
- Page 512 and 513:
C.4 Science Mission Phase: 8/27/04
- Page 514 and 515:
• GP-B also has an independent da
- Page 516 and 517:
free suspension parameters to de-tu
- Page 518 and 519:
We have received inquiries about a
- Page 520 and 521:
One of the effects of geomagnetic s
- Page 522 and 523:
egan transmitting, one-by-one, stat
- Page 524 and 525:
28 JANUARY 2005—GRAVITY PROBE B M
- Page 526 and 527:
magnetic pole. This event triggered
- Page 528 and 529:
8 APRIL 2005—GRAVITY PROBE B MISS
- Page 530 and 531:
On Tuesday afternoon (19-April), GP
- Page 532 and 533:
Norway or through the NASA space ne
- Page 534 and 535:
Dewar Temperature: 1.82 kelvin, hol
- Page 536 and 537:
visitors on a tour of the GP-B faci
- Page 538 and 539:
test, we are planning on running fi
- Page 540 and 541:
contractor at the Goddard Space Fli
- Page 542 and 543:
On Wednesday, we visited the star H
- Page 544 and 545:
Gyro Suspension System (GSS): All 4
- Page 546 and 547:
The helium in the dewar has now sur
- Page 548 and 549:
the all the spacecraft status data.
- Page 550 and 551:
522 March 2007 Appendix D — Summa
- Page 552 and 553:
Figure D-2 below shows the distribu
- Page 554 and 555:
DateSeveritySubtypeTitle Descriptio
- Page 556 and 557:
DateSeverity24 26-Apr-04 Obs F Nois
- Page 558 and 559:
DateSeverity40 11-May-04 Obs T Dwel
- Page 560 and 561:
DateSeveritySubtypeTitle Descriptio
- Page 562 and 563:
DateSeverity68 16-Jun-04 Medium Dec
- Page 564 and 565:
DateSeverity84 13-Jul-04 Obs F Slig
- Page 566 and 567:
DateSeveritySubtypeTitle Descriptio
- Page 568 and 569:
DateSeverity116 26-Sep-04 Obs F SG3
- Page 570 and 571:
DateSeverity132 20-Dec-04 Obs F Unc
- Page 572 and 573:
DateSeverity149 5-Mar-05 Obs T Few
- Page 574 and 575:
DateSeverity169 04-Jun-05 Obs F MBE
- Page 576 and 577:
DateSeverity191 04-Oct-05 Obs A GSS
- Page 578 and 579:
550 March 2007 Appendix E — Fligh
- Page 580 and 581:
ReqIDLevel 1CSCDMP DataMgmtProcessi
- Page 582 and 583:
ReqIDLevel 1CSCLevel2 CSC Level 3 C
- Page 584 and 585:
ReqIDLevel 1CSCLevel2 CSC Level 3 C
- Page 586 and 587:
ReqIDLevel 1CSCLevel2 CSC Level 3 C
- Page 588 and 589:
ReqIDLevel 1CSCSRM Solid StateRecor
- Page 590 and 591:
ReqIDLevel 1CSCLevel2 CSC Level 3 C
- Page 592 and 593:
ReqIDLevel 1CSCLevel2 CSC Level 3 C
- Page 594 and 595:
ReqIDLevel 1CSCSRP SafemodeResponse
- Page 596 and 597:
ReqIDLevel 1CSCGUP GSS Processing g
- Page 598 and 599:
570 March 2007 Appendix F — Acron
- Page 600 and 601:
AcronymDefinitionAcronymDefinitionB
- Page 602 and 603:
AcronymDefinitionAcronymDefinitionD
- Page 604 and 605:
AcronymDefinitionAcronymDefinitionF
- Page 606 and 607:
AcronymDefinitionIRUInertial Refere
- Page 608 and 609:
AcronymDefinitionAcronymDefinitionM
- Page 610 and 611:
AcronymPMPMAPMCPMEPMETPMSPMSUPNPoPO
- Page 612 and 613:
AcronymSCMOSCMTSCNSCPASCPMSCRSCSASC
- Page 614 and 615:
AcronymDefinitionAcronymDefinitionT
- Page 616:
588 March 2007 Appendix F — Acron