coal trade bulletin - Clpdigital.org
coal trade bulletin - Clpdigital.org
coal trade bulletin - Clpdigital.org

You also want an ePaper? Increase the reach of your titles
YUMPU automatically turns print PDFs into web optimized ePapers that Google loves.
THE COAL TRADE BULLETIN. 26<br />
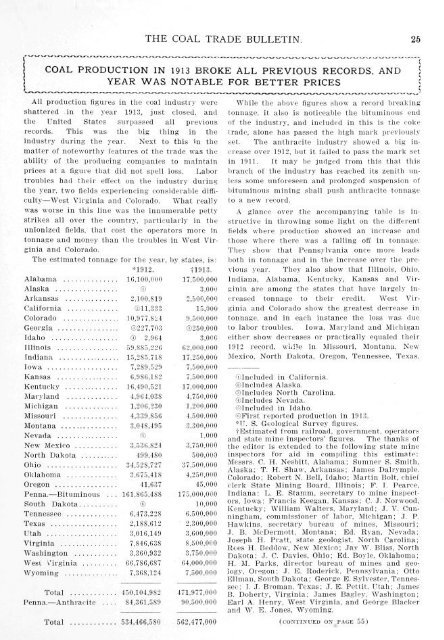
COAL PRODUCTION IN 1913 BROKE ALL PREVIOUS RECORDS, AND<br />
YEAR WAS NOTABLE FOR BETTER PRICES<br />
All production figures in the <strong>coal</strong> industry were<br />
shattered in the year 1913, just closed, and<br />
the United States surpassed all previous<br />
records. This was the big thing in the<br />
industry during the year. Next, to this in the<br />
matter of noteworthy features of the <strong>trade</strong> was the<br />
ability of the producing companies to maintain<br />
prices at a figure that did not spell loss. Labor<br />
troubles had their effect on the industry during<br />
the year, two fields experiencing considerable difficulty—West<br />
Virginia and Colorado. What really<br />
was worse in this line was tbe innumerable petty<br />
strikes all over the country, particularly in the<br />
unionized fields, that cost the operators more in<br />
tonnage and money than the troubles in West Virginia<br />
and Colorado.<br />
The estimated tonnage for the year, by states, is:<br />
*1912, JT913.<br />
Alabama 16,100,000 17,500,000<br />
Alaska ® 3,000<br />
Arkansas 2.100,819 2,500,000<br />
California ©11,333 15,000<br />
Colorado 10,977,824 9,500,000<br />
Ge<strong>org</strong>ia ©227,703 ©250,000<br />
Idaho © 2,964 3,000<br />
Illinois 59,885,226 62,000,000<br />
Indiana 15,285,718 17,250,000<br />
Iowa 7,289.529 7,500,000<br />
Kansas 6,986,1S2 7,500.000<br />
Kentucky 16,490,521 17,000,000<br />
Maryland 4,964,038 4,750,000<br />
Michigan 1,206,230 1,200,000<br />
Missouri 4,339,856 4,500,000<br />
Montana 3.04S.495 3,300,000<br />
Nevada © 1,000<br />
New Mexico 3,536,824 3,750,000<br />
North Dakota 499,480 500,000<br />
Ohio 34,528,727 37,500,000<br />
Oklahoma 3,675,418 4,250,01)0<br />
Oregon 41,637 45,000<br />
Penna.—Bituminous . . . 161.865,488 175,000,000<br />
South Dakota © 10,000<br />
Tennessee 6,473,228 6,500.000<br />
Texas 2,188,612 2,300,000<br />
Utah 3,016,149 3,600,000<br />
Virginia 7.S46.63S S,500,0(i0<br />
Washington 3,360,932 3,750,000<br />
West Virginia 66,786,687 64,000,000<br />
Wyoming 7,368,124 7,500,000<br />
Total<br />
Penna.—Anthracite<br />
450,104,982<br />
S4.361.5S9<br />
Total 534,466,5S0<br />
471,977,000<br />
90,500,000<br />
562,477,000<br />
While the above figures show a record breaking<br />
tonnage, it also is noticeable the bituminous end<br />
of the industry, and included in this is the coke<br />
<strong>trade</strong>, alone has passed the high mark previously<br />
set. The anthracite industry showed a big increase<br />
over 1912, but it failed to pass the mark set<br />
in 1911. It may be judged from this that this<br />
branch of the industry has reached its zenith unless<br />
some unforeseen and prolonged suspension of<br />
liituminous mining shall push anthracite tonnage<br />
to a new record.<br />
A glance over the accompanying table is instructive<br />
in throwing some light on the different<br />
fields where production showed an increase and<br />
those where there was a falling off in tonnage.<br />
They show that Pennsylvania once more leads<br />
both in tonnage and in the increase over the previous<br />
year. They also show that Illinois, Ohio,<br />
Indiana, Alabama, Kentucky, Kansas and Virginia<br />
are among the states that have largely increased<br />
tonnage to their credit. West Virginia<br />
and Colorado show the greatest decrease in<br />
tonnage, and in each instance the loss was due<br />
to labor troubles. Iowa, Maryland and Michigan<br />
either show decreases or practically equaled their<br />
1912 record, while in Missouri, Montana, New<br />
Mexico. North Dakota, Oregon, Tennessee. Texas,<br />
©Included in California.<br />
©Includes Alaska.<br />
©Includes North Carolina.<br />
©Includes Nevada.<br />
©Included in Idaho.<br />
©First reported production in 1913.<br />
*U. S. Geological Survey figures.<br />
tEstimated from railroad, government, operators<br />
and state mine inspectors' figures. The thanks of<br />
the editor is extended to the following state mine<br />
inspectors for aid in compiling this estimate;<br />
Messrs. C. H. Nesbitt, Alabama; Sumner S. Smith,<br />
Alaska; T. H. Shaw, Arkansas; James Dalrymple.<br />
Colorado; Robert N. Bell, Idaho; Martin Bolt, chief<br />
clerk State Mining Board, Illinois; F. I. Pearce,<br />
Indiana: L. E. Stamm, secretary to mine inspectors,<br />
Iowa: Francis Keegan, Kansas; C. J. Norwood,<br />
Kentucky; William Walters, Maryland; J. V. Cunningham,<br />
commissioner of labor, Michigan; J. P.<br />
Hawkins, secretary bureau of mines, Missouri;<br />
J. B. McDermott, Montana: Ed. Ryan, Nevada:<br />
.Joseph H. Pratt, state geologist, North Carolina;<br />
Rees H. Beddow, New Mexico; Jay W. Bliss, North<br />
Dakota: J. C. Davies, Ohio; Ed. Boyle, Oklahoma;<br />
H. M. Parks, director bureau of mines and geology,<br />
Oregon: ,1. E. Roderick, Pennsylvania; Otto<br />
Ellman, South Dakota; Ge<strong>org</strong>e E. Sylvester, Tennessee;<br />
I. J. Broman. Texas; J. E. Pettit, Utah; James<br />
B. Doherty, Virginia: James Bagley. Washington;<br />
Earl A. Henry, West Virginia, and Ge<strong>org</strong>e Blacker<br />
and W. E. Jones, Wyoming.<br />
(CONTINUED ON PAGE 55)<br />
!