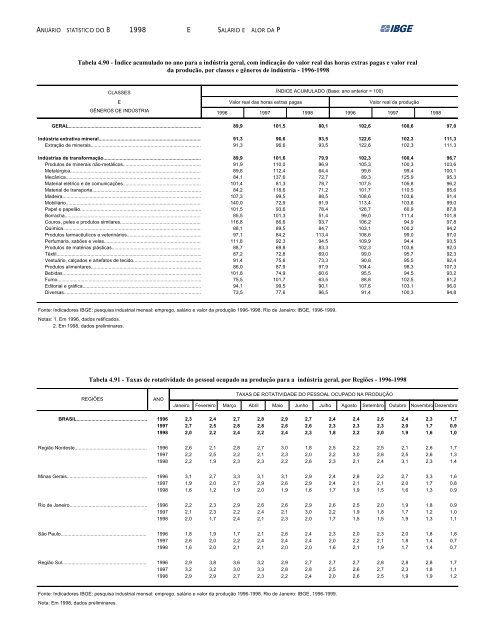
ANUÁRIO STATÍSTICO DO B <strong>1998</strong> E SALÁRIO E ALOR DA P Tabela 4.90 - Índice acumulado no ano para a indústria geral, com indicação do valor real das horas extras pagas e valor real da produção, por classes e gêneros de indústria - 1996-<strong>1998</strong> CLASSES ÍNDICE ACUMULADO (Base: ano anterior = 100) E Valor real das horas extras pagas Valor real da produção GÊNEROS DE INDÚSTRIA 1996 1997 <strong>1998</strong> 1996 1997 <strong>1998</strong> GERAL....................................................................................................................... 89,9 101,5 80,1 102,6 100,6 97,0 Indústria extrativa mineral........................................................................................................ 91,3 96,6 93,5 122,6 102,3 111,3 Extração de minerais................................................................................................................ 91,3 96,6 93,5 122,6 102,3 111,3 Indústrias de transformação......................................................................................................... 89,9 101,6 79,9 102,3 100,4 96,7 Produtos de minerais não-metálicos................................................................................................................ 91,9 110,0 96,9 105,3 100,3 103,6 Metalúrgica..................................................................................................................... 89,8 112,4 64,4 99,6 99,4 100,1 Mecânica...........................................................................................................................84,1 137,6 72,7 89,3 125,9 95,3 Material elétrico e de comunicações............................................................................................... 101,4 81,3 78,7 107,5 105,8 96,2 Material de transporte................................................................................................................. 84,2 118,6 71,2 101,7 110,5 85,6 Madeira........................................................................................................................................... 107,3 99,5 88,5 108,6 103,6 91,4 Mobiliário............................................................................................................................... 140,0 72,9 91,9 113,4 103,6 99,0 Papel e papelão..................................................................................................................................... 101,5 93,6 78,4 126,7 60,9 87,8 Borracha..................................................................................................................................... 85,5 101,3 51,4 99,0 111,4 101,8 Couros, peles e produtos similares................................................................................................................... 116,8 86,6 93,7 106,2 94,9 97,8 Química............................................................................................................................................ 88,1 89,5 84,7 103,1 100,2 94,2 Produtos farmacêuticos e veterinários................................................................................................................. 97,1 84,2 113,4 108,6 99,0 97,0 Perfumaria, sabões e velas................................................................................................................... 111,8 92,3 94,5 109,9 94,4 93,5 Produtos de matérias plásticas........................................................................................................................ 88,7 69,8 83,3 102,3 103,6 92,0 Têxtil......................................................................................................................................................... 87,2 72,8 69,0 99,0 95,7 92,3 Vestuário, calçados e artefatos de tecido................................................................................................................... 91,4 75,6 73,3 90,8 95,5 92,4 Produtos alimentares..................................................................................................................................... 86,0 87,9 97,9 104,4 98,3 107,3 Bebidas................................................................................................................................................ 101,8 74,9 60,6 95,5 94,5 93,2 Fumo................................................................................................................................................... 75,5 101,7 63,5 88,8 102,5 81,2 Editorial e gráfica.............................................................................................................................................. 94,1 99,5 90,1 107,6 103,1 96,0 Diversas............................................................................................................................................ 73,5 77,6 96,5 91,4 100,3 94,8 Fonte: Indicadores IBGE: pesquisa industrial mensal: emprego, salário e valor da produção 1996-<strong>1998</strong>. Rio de Janeiro: IBGE, 1996-1999. Notas: 1. Em 1996, dados retificados. 2. Em <strong>1998</strong>, dados preliminares. Tabela 4.91 - Taxas de rotatividade do pessoal ocupado na produção para a indústria geral, por Regiões - 1996-<strong>1998</strong> REGIÕES ANO TAXAS DE ROTATIVIDADE DO PESSOAL OCUPADO NA PRODUÇÃO Janeiro Fevereiro Março Abril Maio Junho Julho Agosto Setembro Outubro Novembro Dezembro BRASIL................................................................................................ 1996 2,3 2,4 2,7 2,8 2,9 2,7 2,4 2,4 2,6 2,4 2,3 1,7 1997 2,7 2,5 2,8 2,8 2,6 2,6 2,3 2,3 2,3 2,0 1,7 0,9 <strong>1998</strong> 2,0 2,2 2,4 2,2 2,4 2,3 1,8 2,2 2,0 1,9 1,6 1,0 Região Nordeste............................................................................................................... 1996 2,6 2,1 2,8 2,7 3,0 1,8 2,5 2,2 2,5 2,1 2,6 1,7 1997 2,2 2,5 2,2 2,1 2,3 2,0 2,2 3,0 2,8 2,5 2,6 1,3 <strong>1998</strong> 2,2 1,9 2,3 2,3 2,2 2,6 2,3 2,1 2,4 3,1 2,3 1,4 Minas Gerais.................................................................................................................... 1996 3,1 2,7 3,3 3,1 3,1 2,9 2,4 2,8 2,2 2,7 3,3 1,6 1997 1,9 2,0 2,7 2,9 2,6 2,9 2,4 2,1 2,1 2,0 1,7 0,8 <strong>1998</strong> 1,6 1,2 1,9 2,0 1,9 1,6 1,7 1,9 1,5 1,6 1,3 0,9 Rio de Janeiro................................................................1996 2,2 2,3 2,9 2,6 2,6 2,9 2,6 2,5 2,0 1,9 1,8 0,9 1997 2,1 2,3 2,2 2,4 2,1 3,0 2,2 1,9 1,8 1,7 1,2 1,0 <strong>1998</strong> 2,0 1,7 2,4 2,1 2,3 2,0 1,7 1,5 1,5 1,9 1,3 1,1 São Paulo..................................................................... 1996 1,8 1,9 1,7 2,1 2,6 2,4 2,3 2,0 2,3 2,0 1,8 1,8 1997 2,6 2,0 2,2 2,4 2,4 2,4 2,0 2,2 2,1 1,8 1,4 0,7 <strong>1998</strong> 1,6 2,0 2,1 2,1 2,0 2,0 1,6 2,1 1,9 1,7 1,4 0,7 Região Sul.................................................................... 1996 2,9 3,8 3,6 3,2 2,9 2,7 2,7 2,7 2,8 2,8 2,8 1,7 1997 3,2 3,2 3,0 3,3 2,8 2,8 2,5 2,6 2,7 2,3 1,8 1,1 <strong>1998</strong> 2,9 2,9 2,7 2,3 2,2 2,4 2,0 2,6 2,5 1,9 1,9 1,2 Fonte: Indicadores IBGE: pesquisa industrial mensal: emprego, salário e valor da produção 1996-<strong>1998</strong>. Rio de Janeiro: IBGE, 1996-1999. Nota: Em <strong>1998</strong>, dados preliminares.
EMPREGO, SALÁRIO E VALOR DA PRODUÇÃO ANUÁRIO ESTATÍSTICO DO BRASIL - <strong>1998</strong> Tabela 4.92 - Taxas médias mensais de rotatividade do pessoal ocupado na produção para a indústria geral, por classes e gêneros de indústria - 1994-<strong>1998</strong> CLASSES E GÊNEROS DE INDÚSTRIA TAXAS MÉDIAS MENSAIS DE ROTATIVIDADE DO PESSOAL OCUPADO NA PRODUÇÃO 1994 1995 1996 1997 <strong>1998</strong> GERAL.................................................................................................................... 2,7 2,8 2,5 2,3 2,0 Indústria extrativa mineral......................................................................................................................... 1,4 1,6 0,9 1,1 0,9 Extração de minerais......................................................................................................................... 1,4 1,6 0,9 1,1 0,9 Indústrias de transformação................................................................................................................ 2,7 2,8 2,5 2,3 2,0 Produtos de minerais não-metálicos...................................................................................................................... 2,9 3,0 2,3 2,2 2,0 Metalúrgica.......................................................................................................................................... 1,7 2,2 1,7 2,0 1,4 Mecânica.............................................................................................................................................. 1,7 1,6 1,6 1,7 1,2 Material elétrico e de comunicações................................................................................................................. 1,6 1,6 2,0 1,4 1,2 Material de transporte............................................................................................................................................. 1,5 1,6 1,4 1,6 1,3 Madeira................................................................................................................................................. 3,2 3,6 3,6 3,2 2,9 Mobiliário...................................................................................................................................................... 3,6 3,2 2,7 2,5 1,9 Papel e papelão........................................................................................................................................ 2,3 2,3 1,6 1,9 1,8 Borracha...................................................................................................................................... 2,6 2,3 1,7 1,9 1,4 Couros, peles e produtos similares......................................................................................................................... 2,9 3,3 3,3 2,5 2,5 Química.......................................................................................................................................... 1,8 1,9 1,7 1,6 1,4 Produtos farmacêuticos e veterinários........................................................................................................................... 1,6 2,2 1,7 1,7 1,4 Perfumaria, sabões e velas.............................................................................................................................. 2,2 3,0 2,2 1,7 1,9 Produtos de matérias plásticas........................................................................................................................ 2,5 2,9 2,8 2,2 1,7 Têxtil............................................................................................................................................. 2,3 2,5 2,3 1,9 1,6 Vestuário, calçados e artefatos de tecido........................................................................................................... 3,4 3,6 3,2 2,8 2,5 Produtos alimentares..................................................................................................................................... 3,7 4,1 3,1 2,5 2,5 Bebidas............................................................................................................................................. 2,2 2,5 2,1 2,0 1,6 Fumo............................................................................................................................................. 3,4 3,8 2,9 3,7 3,3 Editorial e gráfica......................................................................................................................2,3 2,6 1,9 2,0 2,1 Diversas.....................................................................................................................................2,6 3,4 2,3 2,2 1,8 Fonte: Indicadores IBGE: pesquisa industrial mensal: emprego, salário e valor da produção 1994-<strong>1998</strong>. Rio de Janeiro: IBGE, 1994-1999. Notas: 1. Em 1996, dados retificados. 2. Em <strong>1998</strong>, dados preliminares.
- Page 2 and 3:
Presidente da República Fernando H
- Page 4 and 5:
IN MEMORIAN ANUÁRIO ESTATÍSTICO D
- Page 6 and 7:
ANUÁRIO ESTATÍSTICO DO BRASIL - 1
- Page 8 and 9:
GUIA DE LEITURA ANUÁRIO ESTATÍSTI
- Page 10 and 11:
RELAÇÃO DAS FONTES ANUÁRIO ESTAT
- Page 12 and 13:
RELAÇÃO DAS FONTES ANUÁRIO ESTAT
- Page 14 and 15:
ANUÁRIO ESTATÍSTICO DO BRASIL - 1
- Page 16 and 17:
ANUÁRIO ESTATÍSTICO DO BRASIL - 1
- Page 19 and 20:
ANUÁRIO ESTATÍSTICO DO BRASIL - 1
- Page 21:
ANUÁRIO ESTATÍSTICO DO BRASIL - 1
- Page 24 and 25:
POSIÇÃO E EXTENSÃO ANUÁRIO ESTA
- Page 26 and 27:
LOCALIZAÇÃO GEOGRÁFICA ANUÁRIO
- Page 28 and 29:
LOCALIZAÇÃO GEOGRÁFICA ANUÁRIO
- Page 30 and 31:
LOCALIZAÇÃO GEOGRÁFICA ANUÁRIO
- Page 32 and 33:
ANUÁRIO ESTATÍSTICO DO BRASIL - 1
- Page 34 and 35:
ANUÁRIO ESTATÍSTICO DO BRASIL - 1
- Page 36 and 37:
Sistema Geodésico Brasileiro Redes
- Page 38 and 39:
ANUÁRIO ESTATÍSTICO DO BRASIL - 1
- Page 40 and 41:
ANUÁRIO ESTATÍSTICO DO BRASIL - 1
- Page 42 and 43:
ANUÁRIO ESTATÍSTICO DO BRASIL - 1
- Page 44 and 45:
Mapeamento Sistemático do Brasil O
- Page 46 and 47:
ANUÁRIO ESTATÍSTICO DO BRASIL - 1
- Page 49 and 50:
ANUÁRIO ESTATÍSTICO DO BRASIL - 1
- Page 51 and 52:
ANUÁRIO ESTATÍSTICO DO BRASIL - 1
- Page 53 and 54:
ANUÁRIO ESTATÍSTICO DO BRASIL - 1
- Page 55 and 56:
ANUÁRIO E STATÍSTICO DO BRASIL -
- Page 57 and 58:
ANUÁRIO ESTATÍSTICO DO BRASIL - 1
- Page 59 and 60:
ANUÁRIO ESTATÍSTICO DO BRASIL - 1
- Page 61 and 62:
CARACTERÍSTICAS DOS MUNICÍPIOS AN
- Page 63 and 64:
CARACTERÍSTICAS DOS MUNICÍPIOS AN
- Page 65:
CARACTERÍSTICAS DOS MUNICÍPIOS AN
- Page 68 and 69:
RECURSOS NATURAIS E MEIO AMBIENTE A
- Page 70 and 71:
ANUÁRIO ESTATÍSTICO DO BRASIL - 1
- Page 72 and 73:
ANUÁRIO ESTATÍSTICO DO BRASIL - 1
- Page 74 and 75:
ANUÁRIO ESTATÍSTICO DO BRASIL - 1
- Page 76 and 77:
ANUÁRIO ESTATÍSTICO DO BRASIL - 1
- Page 78 and 79:
ANUÁRIO ESTATÍSTICO DO BRASIL - 1
- Page 80 and 81:
CLIMA ANUÁRIO E STATÍSTICO DO BRA
- Page 82 and 83:
CLIMA ANUÁRIO ESTATÍSTICO DO BRAS
- Page 84 and 85:
CLIMA ANUÁRIO ESTATÍSTICO DO BRAS
- Page 86 and 87:
ANUÁRIO ESTATÍSTICO DO BRASIL - 1
- Page 88 and 89:
ANUÁRIO ESTATÍSTICO DO BRASIL - 1
- Page 90 and 91:
ANUÁRIO ESTATÍSTICO DO BRASIL - 1
- Page 92 and 93:
ANUÁRIO ESTATÍSTICO DO BRASIL - 1
- Page 94 and 95:
ANUÁRIO ESTATÍSTICO DO BRASIL - 1
- Page 96 and 97:
ANUÁRIO ESTATÍSTICO DO BRASIL - 1
- Page 98 and 99:
ANUÁRIO ESTATÍSTICO DO BRASIL - 1
- Page 100 and 101:
ANUÁRIO ESTATÍSTICO DO BRASIL - 1
- Page 102 and 103:
ANUÁRIO ESTATÍSTICO DO BRASIL - 1
- Page 104 and 105:
ANUÁRIO ESTATÍSTICO DO BRASIL - 1
- Page 106 and 107:
ANUÁRIO ESTATÍSTICO DO BRASIL - 1
- Page 108 and 109:
ANUÁRIO E STATÍSTICO DO BRASIL -
- Page 110 and 111:
ANUÁRIO ESTATÍSTICO DO BRASIL - 1
- Page 112 and 113:
ANUÁRIO E STATÍSTICO DO BRASIL -
- Page 114 and 115:
ANUÁRIO ESTATÍSTICO DO BRASIL - 1
- Page 116 and 117:
ANUÁRIO ESTATÍSTICO DO BRASIL - 1
- Page 118 and 119:
ANUÁRIO ESTATÍSTICO DO BRASIL - 1
- Page 120 and 121:
ANUÁRIO ESTATÍSTICO DO BRASIL - 1
- Page 122 and 123:
ANUÁRIO ESTATÍSTICO DO BRASIL - 1
- Page 124 and 125:
ANUÁRIO ESTATÍSTICO DO BRASIL - 1
- Page 126 and 127:
ANUÁRIO ESTATÍSTICO DO BRASIL - 1
- Page 128 and 129:
ANUÁRIO E STATÍSTICO DO BRASIL -
- Page 130 and 131:
ANUÁRIO ESTATÍSTICO DO BRASIL - 1
- Page 132 and 133:
ANUÁRIO ESTATÍSTICO DO BRASIL - 1
- Page 134 and 135:
ANUÁRIO ESTATÍSTICO DO BRASIL - 1
- Page 136 and 137:
ANUÁRIO ESTATÍSTICO DO BRASIL - 1
- Page 138 and 139:
FAUNA ANUÁRIO ESTATÍSTICO DO BRAS
- Page 140 and 141:
FAUNA ANUÁRIO ESTATÍSTICO DO BRAS
- Page 142 and 143:
FAUNA ANUÁRIO ESTATÍSTICO DO BRAS
- Page 144 and 145:
ANUÁRIO ESTATÍSTICO DO BRASIL - 1
- Page 146 and 147:
ANUÁRIO ESTATÍSTICO DO BRASIL - 1
- Page 148 and 149:
ANUÁRIO ESTATÍSTICO DO BRASIL - 1
- Page 150 and 151:
ANUÁRIO ESTATÍSTICO DO BRASIL - 1
- Page 152 and 153:
ANUÁRIO ESTATÍSTICO DO BRASIL - 1
- Page 154 and 155:
ANUÁRIO ESTATÍSTICO DO BRASIL - 1
- Page 156 and 157:
ANUÁRIO ESTATÍSTICO DO BRASIL - 1
- Page 158 and 159:
ANUÁRIO ESTATÍSTICO DO BRASIL - 1
- Page 160 and 161:
ANUÁRIO ESTATÍSTICO DO BRASIL - 1
- Page 162:
ANUÁRIO ESTATÍSTICO DO BRASIL - 1
- Page 165 and 166:
DINÂMICA ESPACIAL ANUÁRIO ESTATÍ
- Page 167 and 168:
DINÂMICA ESPACIAL ANUÁRIO ESTATÍ
- Page 169 and 170:
DINÂMICA ESPACIAL ANUÁRIO ESTATÍ
- Page 171 and 172:
DINÂMICA ESPACIAL ANUÁRIO ESTATÍ
- Page 173 and 174:
DINÂMICA ESPACIAL ANUÁRIO ESTATÍ
- Page 175 and 176:
DINÂMICA ESPACIAL ANUÁRIO ESTATÍ
- Page 177 and 178:
REDE URBANA BRASILEIRA ANUÁRIO E S
- Page 179 and 180:
REDE URBANA BRASILEIRA ANUÁRIO E S
- Page 181 and 182:
REDE URBANA BRASILEIRA ANUÁRIO E S
- Page 183 and 184:
GLOSSÁRIO ANUÁRIO ESTATÍSTICO DO
- Page 185 and 186:
GLOSSÁRIO ANUÁRIO ESTATÍSTICO DO
- Page 187 and 188:
GLOSSÁRIO ANUÁRIO ESTATÍSTICO DO
- Page 189 and 190:
BIBLIOGRAFIA ANUÁRIO ESTATÍSTICO
- Page 191 and 192:
BIBLIOGRAFIA ANUÁRIO ESTATÍSTICO
- Page 193 and 194:
SUMÁRIO DAS SEÇÕES ANUÁRIO ESTA
- Page 195 and 196:
SUMÁRIO DAS SEÇÕES ANUÁRIO ESTA
- Page 197 and 198:
SUMÁRIO DAS SEÇÕES ANUÁRIO ESTA
- Page 199 and 200:
SUMÁRIO DAS SEÇÕES ANUÁRIO ESTA
- Page 202 and 203:
ANUÁRIO ESTATÍSTICO DO BRASIL - 1
- Page 205 and 206:
ANUÁRIO ESTATÍSTICO DO BRASIL - 1
- Page 207 and 208:
ANUÁRIO ESTATÍSTICO DO BRASIL - 1
- Page 209 and 210:
ANUÁRIO ESTATÍSTICO DO BRASIL - 1
- Page 211 and 212:
ANUÁRIO ESTATÍSTICO DO BRASIL - 1
- Page 213 and 214:
ANUÁRIO ESTATÍSTICO DO BRASIL - 1
- Page 215 and 216:
ANUÁRIO ESTATÍSTICO DO BRASIL - 1
- Page 217 and 218:
ANUÁRIO ESTATÍSTICO DO BRASIL - 1
- Page 219 and 220:
ANUÁRIO ESTATÍSTICO DO BRASIL - 1
- Page 221 and 222:
ANUÁRIO ESTATÍSTICO DO BRASIL - 1
- Page 223 and 224:
ANUÁRIO ESTATÍSTICO DO BRASIL - 1
- Page 225 and 226:
ANUÁRIO ESTATÍSTICO DO BRASIL - 1
- Page 227 and 228:
ANUÁRIO ESTATÍSTICO DO BRASIL - 1
- Page 229 and 230:
ANUÁRIO ESTATÍSTICO DO BRASIL - 1
- Page 231 and 232:
ANUÁRIO ESTATÍSTICO DO BRASIL - 1
- Page 233 and 234:
ANUÁRIO ESTATÍSTICO DO BRASIL - 1
- Page 235 and 236:
ANUÁRIO ESTATÍSTICO DO BRASIL - 1
- Page 237:
ANUÁRIO ESTATÍSTICO DO BRASIL - 1
- Page 240 and 241:
2 - 44 TRABALHO E RENDIMENTO ANUÁR
- Page 242 and 243:
POPULAÇÃO EM IDADE ATIVA ANUÁRIO
- Page 244 and 245:
POPULAÇÃO EM IDADE ATIVA ANUÁRIO
- Page 246 and 247:
POPULAÇÃO EM IDADE ATIVA ANUÁRIO
- Page 248 and 249:
POPULAÇÃO EM IDADE ATIVA ANUÁRIO
- Page 250 and 251:
POPULAÇÃO OCUPADA ANUÁRIO ESTAT
- Page 252 and 253:
POPULAÇÃO OCUPADA ANUÁRIO ESTAT
- Page 254 and 255:
POPULAÇÃO OCUPADA ANUÁRIO ESTAT
- Page 256 and 257:
POPULAÇÃO OCUPADA ANUÁRIO ESTAT
- Page 258 and 259:
POPULAÇÃO OCUPADA ANUÁRIO ESTAT
- Page 260 and 261:
POPULAÇÃO OCUPADA ANUÁRIO ESTAT
- Page 262 and 263:
POPULAÇÃO OCUPADA ANUÁRIO ESTAT
- Page 264 and 265:
POPULAÇÃO OCUPADA ANUÁRIO ESTAT
- Page 266 and 267:
POPULAÇÃO EMPREGADA ANUÁRIO ESTA
- Page 268 and 269:
POPULAÇÃO EMPREGADA ANUÁRIO ESTA
- Page 270 and 271:
POPULAÇÃO EMPREGADA ANUÁRIO ESTA
- Page 272 and 273:
POPULAÇÃO EMPREGADA ANUÁRIO ESTA
- Page 274 and 275:
ECONOMIA INFORMAL ANUÁRIO ESTATÍS
- Page 276:
ECONOMIA INFORMAL ANUÁRIO ESTATÍS
- Page 279 and 280:
SAÚDE ANUÁRIO ESTATÍSTICO DO BRA
- Page 281 and 282:
SAÚDE ANUÁRIO ESTATÍSTICO DO BRA
- Page 283 and 284:
SAÚDE ANUÁRIO ESTATÍSTICO DO BRA
- Page 285 and 286:
SAÚDE ANUÁRIO ESTATÍSTICO DO BRA
- Page 287 and 288:
SAÚDE ANUÁRIO ESTATÍSTICO DO BRA
- Page 289 and 290:
SAÚDE ANUÁRIO ESTATÍSTICO DO BRA
- Page 291 and 292:
SAÚDE ANUÁRIO ESTATÍSTICO DO BRA
- Page 293 and 294:
SAÚDE ANUÁRIO ESTATÍSTICO DO BRA
- Page 295 and 296:
SAÚDE ANUÁRIO ESTATÍSTICO DO BRA
- Page 297 and 298:
SAÚDE ANUÁRIO ESTATÍSTICO DO BRA
- Page 299 and 300:
SAÚDE ANUÁRIO ESTATÍSTICO DO BRA
- Page 301 and 302:
SAÚDE ANUÁRIO ESTATÍSTICO DO BRA
- Page 303 and 304:
SAÚDE ANUÁRIO ESTATÍSTICO DO BRA
- Page 305 and 306:
SAÚDE ANUÁRIO ESTATÍSTICO DO BRA
- Page 307 and 308:
PREVIDÊNCIA SOCIAL ANUÁRIO ESTAT
- Page 309 and 310:
PREVIDÊNCIA SOCIAL ANUÁRIO ESTAT
- Page 311 and 312:
PREVIDÊNCIA SOCIAL ANUÁRIO ESTAT
- Page 313 and 314:
PREVIDÊNCIA SOCIAL ANUÁRIO ESTAT
- Page 315 and 316:
PREVIDÊNCIA SOCIAL ANUÁRIO ESTAT
- Page 318 and 319:
ANUÁRIO ESTATÍSTICO DO BRASIL - 1
- Page 320 and 321:
ANUÁRIO ESTATÍSTICO DO BRASIL - 1
- Page 322 and 323:
ANUÁRIO ESTATÍSTICO DO BRASIL - 1
- Page 324 and 325:
ANUÁRIO ESTATÍSTICO DO BRASIL - 1
- Page 326 and 327:
ANUÁRIO ESTATÍSTICO DO BRASIL - 1
- Page 328 and 329:
ANUÁRIO ESTATÍSTICO DO BRASIL - 1
- Page 330 and 331:
ANUÁRIO ESTATÍSTICO DO BRASIL - 1
- Page 332 and 333:
ANUÁRIO ESTATÍSTICO DO BRASIL - 1
- Page 334 and 335:
ANUÁRIO ESTATÍSTICO DO BRASIL - 1
- Page 336 and 337:
ANUÁRIO ESTATÍSTICO DO BRASIL - 1
- Page 338 and 339:
ANUÁRIO ESTATÍSTICO DO BRASIL - 1
- Page 340 and 341:
ANUÁRIO ESTATÍSTICO DO BRASIL - 1
- Page 342 and 343:
ANUÁRIO ESTATÍSTICO DO BRASIL - 1
- Page 344 and 345:
ANUÁRIO ESTATÍSTICO DO BRASIL - 1
- Page 346 and 347:
ANUÁRIO ESTATÍSTICO DO BRASIL - 1
- Page 348 and 349:
ANUÁRIO ESTATÍSTICO DO BRASIL - 1
- Page 350 and 351:
ANUÁRIO ESTATÍSTICO DO BRASIL - 1
- Page 352 and 353:
ANUÁRIO ESTATÍSTICO DO BRASIL - 1
- Page 354 and 355:
ANUÁRIO ESTATÍSTICO DO BRASIL - 1
- Page 356 and 357:
ANUÁRIO ESTATÍSTICO DO BRASIL - 1
- Page 358 and 359:
ANUÁRIO ESTATÍSTICO DO BRASIL - 1
- Page 360 and 361:
ANUÁRIO ESTATÍSTICO DO BRASIL - 1
- Page 362 and 363:
ANUÁRIO ESTATÍSTICO DO BRASIL - 1
- Page 364 and 365:
ANUÁRIO ESTATÍSTICO DO BRASIL - 1
- Page 366 and 367:
ANUÁRIO ESTATÍSTICO DO BRASIL - 1
- Page 368 and 369:
ANUÁRIO ESTATÍSTICO DO BRASIL - 1
- Page 370 and 371:
ANUÁRIO ESTATÍSTICO DO BRASIL - 1
- Page 372 and 373:
ANUÁRIO ESTATÍSTICO DO BRASIL - 1
- Page 374 and 375:
ANUÁRIO ESTATÍSTICO DO BRASIL - 1
- Page 376 and 377:
ANUÁRIO ESTATÍSTICO DO BRASIL - 1
- Page 378:
ANUÁRIO ESTATÍSTICO DO BRASIL - 1
- Page 381 and 382:
CARACTERÍSTICAS DO DOMICÍLIO ANU
- Page 383 and 384:
CARACTERÍSTICAS DO DOMICÍLIO ANU
- Page 385 and 386:
CARACTERÍSTICAS DO DOMICÍLIO ANU
- Page 387 and 388:
CONSUMO DOMICILIAR ANUÁRIO ESTATÍ
- Page 389 and 390:
CONSUMO DOMICILIAR ANUÁRIO ESTATÍ
- Page 391 and 392:
CONSUMO DOMICILIAR ANUÁRIO ESTATÍ
- Page 393 and 394:
CONSUMO DOMICILIAR ANUÁRIO ESTATÍ
- Page 395:
CONSUMO DOMICILIAR ANUÁRIO ESTATÍ
- Page 398 and 399:
JUSTIÇA ANUÁRIO ESTATÍSTICO DO B
- Page 400 and 401:
JUSTIÇA ANUÁRIO ESTATÍSTICO DO B
- Page 402 and 403:
SEGURANÇA PÚBLICA ANUÁRIO ESTAT
- Page 404:
SEGURANÇA PÚBLICA ANUÁRIO ESTAT
- Page 407 and 408:
MOVIMENTO ELEITORAL ANUÁRIO ESTAT
- Page 409 and 410:
MOVIMENTO ELEITORAL ANUÁRIO ESTAT
- Page 411 and 412:
ANUÁRIO ESTATÍSTICO DO BRASIL - 1
- Page 413 and 414:
ANUÁRIO ESTATÍSTICO DO BRASIL - 1
- Page 415 and 416:
ANUÁRIO ESTATÍSTICO DO BRASIL - 1
- Page 417 and 418:
ANUÁRIO ESTATÍSTICO DO BRASIL - 1
- Page 419 and 420:
ANUÁRIO ESTATÍSTICO DO BRASIL - 1
- Page 421 and 422:
ANUÁRIO ESTATÍSTICO DO BRASIL - 1
- Page 423 and 424:
ANUÁRIO ESTATÍSTICO DO BRASIL - 1
- Page 425 and 426:
ANUÁRIO ESTATÍSTICO DO BRASIL - 1
- Page 427 and 428:
ANUÁRIO ESTATÍSTICO DO BRASIL - 1
- Page 429 and 430:
ANUÁRIO ESTATÍSTICO DO BRASIL - 1
- Page 431 and 432:
ANUÁRIO ESTATÍSTICO DO BRASIL - 1
- Page 433 and 434:
ANUÁRIO ESTATÍSTICO DO BRASIL - 1
- Page 435 and 436:
ANUÁRIO ESTATÍSTICO DO BRASIL - 1
- Page 437 and 438:
ANUÁRIO ESTATÍSTICO DO BRASIL - 1
- Page 439 and 440:
ANUÁRIO ESTATÍSTICO DO BRASIL - 1
- Page 441 and 442:
ANUÁRIO ESTATÍSTICO DO BRASIL - 1
- Page 443 and 444:
ANUÁRIO ESTATÍSTICO DO BRASIL - 1
- Page 445 and 446:
ANUÁRIO ESTATÍSTICO DO BRASIL - 1
- Page 447 and 448:
ANUÁRIO ESTATÍSTICO DO BRASIL - 1
- Page 449 and 450:
ANUÁRIO ESTATÍSTICO DO BRASIL - 1
- Page 451 and 452:
ANUÁRIO ESTATÍSTICO DO BRASIL - 1
- Page 453 and 454:
ANUÁRIO ESTATÍSTICO DO BRASIL - 1
- Page 455 and 456:
ANUÁRIO ESTATÍSTICO DO BRASIL - 1
- Page 457 and 458:
ANUÁRIO ESTATÍSTICO DO BRASIL - 1
- Page 459 and 460:
ANUÁRIO ESTATÍSTICO DO BRASIL - 1
- Page 461 and 462:
ANUÁRIO ESTATÍSTICO DO BRASIL - 1
- Page 463 and 464:
ANUÁRIO ESTATÍSTICO DO BRASIL - 1
- Page 465 and 466:
ANUÁRIO ESTATÍSTICO DO BRASIL - 1
- Page 467 and 468:
ANUÁRIO ESTATÍSTICO DO BRASIL - 1
- Page 469 and 470:
ANUÁRIO ESTATÍSTICO DO BRASIL - 1
- Page 471 and 472:
ANUÁRIO ESTATÍSTICO DO BRASIL - 1
- Page 473 and 474:
ANUÁRIO ESTATÍSTICO DO BRASIL - 1
- Page 475 and 476:
ANUÁRIO ESTATÍSTICO DO BRASIL - 1
- Page 477 and 478:
ANUÁRIO ESTATÍSTICO DO BRASIL - 1
- Page 479 and 480:
ANUÁRIO ESTATÍSTICO DO BRASIL - 1
- Page 481 and 482:
ANUÁRIO ESTATÍSTICO DO BRASIL - 1
- Page 483 and 484:
ANUÁRIO ESTATÍSTICO DO BRASIL - 1
- Page 485 and 486:
ANUÁRIO ESTATÍSTICO DO BRASIL - 1
- Page 487 and 488:
ANUÁRIO ESTATÍSTICO DO BRASIL - 1
- Page 489 and 490:
ANUÁRIO ESTATÍSTICO DO BRASIL - 1
- Page 491:
ANUÁRIO ESTATÍSTICO DO BRASIL - 1
- Page 494:
ASPECTOS DAS ATIVIDADES AGROPECUÁR
- Page 497 and 498:
ARMAZENAGEM E ESTOCAGEM ANUÁRIO ES
- Page 499 and 500:
ARMAZENAGEM E ESTOCAGEM ANUÁRIO ES
- Page 501:
ARMAZENAGEM E ESTOCAGEM ANUÁRIO ES
- Page 504 and 505:
CRÉDITO E ASSISTÊNCIA RURAL ANUÁ
- Page 506 and 507:
CRÉDITO E ASSISTÊNCIA RURAL ANUÁ
- Page 508:
CRÉDITO E ASSISTÊNCIA RURAL ANUÁ
- Page 511 and 512:
AGRICULTURA ANUÁRIO ESTATÍSTICO D
- Page 513 and 514:
AGRICULTURA ANUÁRIO ESTATÍSTICO D
- Page 515 and 516:
AGRICULTURA ANUÁRIO ESTATÍSTICO D
- Page 517 and 518:
AGRICULTURA ANUÁRIO ESTATÍSTICO D
- Page 519 and 520:
AGRICULTURA ANUÁRIO ESTATÍSTICO D
- Page 521 and 522:
AGRICULTURA ANUÁRIO ESTATÍSTICO D
- Page 523 and 524:
EXTRAÇÃO VEGETAL E SILVICULTURA A
- Page 525 and 526:
EXTRAÇÃO VEGETAL E SILVICULTURA A
- Page 528 and 529:
Produção Animal No tema Produçã
- Page 530 and 531:
ANUÁRIO ESTATÍSTICO DO BRASIL - 1
- Page 532 and 533:
ANUÁRIO ESTATÍSTICO DO BRASIL - 1
- Page 534:
ANUÁRIO ESTATÍSTICO DO BRASIL - 1
- Page 537 and 538:
EFETIVO PECUÁRIO ANUÁRIO ESTATÍS
- Page 539 and 540:
Glossário animais abatidos (Pesqui
- Page 541 and 542:
ANUÁRIO ESTATÍSTICO DO BRASIL - 1
- Page 543 and 544:
ANUÁRIO ESTATÍSTICO DO BRASIL - 1
- Page 545 and 546:
ANUÁRIO ESTATÍSTICO DO BRASIL - 1
- Page 547:
ANUÁRIO ESTATÍSTICO DO BRASIL - 1
- Page 550:
ASPECTOS DA ATIVIDADE INDÚSTRIA AN
- Page 553 and 554:
INDÚSTRIAS EXTRATIVA MINERAL E DE
- Page 555 and 556:
DADOS GERAIS ANUÁRIO ESTATÍSTICO
- Page 557 and 558:
DADOS GERAIS ANUÁRIO ESTATÍSTICO
- Page 559 and 560:
DADOS GERAIS ANUÁRIO ESTATÍSTICO
- Page 561 and 562:
DADOS GERAIS ANUÁRIO ESTATÍSTICO
- Page 563 and 564:
DADOS GERAIS ANUÁRIO ESTATÍSTICO
- Page 565 and 566:
DADOS GERAIS ANUÁRIO ESTATÍSTICO
- Page 567 and 568:
DADOS GERAIS ANUÁRIO ESTATÍSTICO
- Page 569 and 570:
DADOS GERAIS ANUÁRIO ESTATÍSTICO
- Page 571 and 572:
PRODUÇÃO E CONSUMO ANUÁRIO ESTAT
- Page 573 and 574:
PRODUÇÃO E CONSUMO ANUÁRIO ESTAT
- Page 575 and 576:
PRODUÇÃO E CONSUMO ANUÁRIO ESTAT
- Page 577 and 578:
PRODUÇÃO E CONSUMO ANUÁRIO ESTAT
- Page 579 and 580:
PRODUÇÃO E CONSUMO ANUÁRIO ESTAT
- Page 581 and 582: PRODUÇÃO E CONSUMO ANUÁRIO ESTAT
- Page 583 and 584: PRODUÇÃO E CONSUMO ANUÁRIO ESTAT
- Page 585 and 586: PRODUÇÃO E CONSUMO ANUÁRIO ESTAT
- Page 587 and 588: PRODUÇÃO E CONSUMO ANUÁRIO ESTAT
- Page 589 and 590: PRODUÇÃO E CONSUMO ANUÁRIO ESTAT
- Page 591 and 592: PRODUÇÃO E CONSUMO ANUÁRIO ESTAT
- Page 593 and 594: PRODUÇÃO E CONSUMO ANUÁRIO ESTAT
- Page 595 and 596: PRODUÇÃO E CONSUMO ANUÁRIO ESTAT
- Page 597 and 598: PRODUÇÃO E CONSUMO ANUÁRIO ESTAT
- Page 600 and 601: ANUÁRIO ESTATÍSTICO DO BRASIL - 1
- Page 602 and 603: ANUÁRIO ESTATÍSTICO DO BRASIL - 1
- Page 605 and 606: ANUÁRIO ESTATÍSTICO DO BRASIL - 1
- Page 607 and 608: ANUÁRIO ESTATÍSTICO DO BRASIL - 1
- Page 609 and 610: ANUÁRIO ESTATÍSTICO DO BRASIL - 1
- Page 611 and 612: ANUÁRIO ESTATÍSTICO DO BRASIL - 1
- Page 613 and 614: ANUÁRIO ESTATÍSTICO DO BRASIL - 1
- Page 615 and 616: ANUÁRIO ESTATÍSTICO DO BRASIL - 1
- Page 617 and 618: ANUÁRIO ESTATÍSTICO DO BRASIL - 1
- Page 620 and 621: ANUÁRIO ESTATÍSTICO DO BRASIL - 1
- Page 622 and 623: ANUÁRIO ESTATÍSTICO DO BRASIL - 1
- Page 624 and 625: ANUÁRIO ESTATÍSTICO DO BRASIL - 1
- Page 626 and 627: ANUÁRIO ESTATÍSTICO DO BRASIL - 1
- Page 628 and 629: ANUÁRIO ESTATÍSTICO DO BRASIL - 1
- Page 630 and 631: ANUÁRIO ESTATÍSTICO DO BRASIL - 1
- Page 635 and 636: ANUÁRIO ESTATÍSTICO DO BRASIL - 1
- Page 637 and 638: Glossário atividade (Pesquisa Indu
- Page 639 and 640: ANUÁRIO ESTATÍSTICO DO BRASIL - 1
- Page 641 and 642: ANUÁRIO ESTATÍSTICO DO BRASIL - 1
- Page 643 and 644: ANUÁRIO ESTATÍSTICO DO BRASIL - 1
- Page 645 and 646: ANUÁRIO ESTATÍSTICO DO BRASIL - 1
- Page 647: ANUÁRIO ESTATÍSTICO DO BRASIL - 1
- Page 650: ASPECTOS DA ATIVIDADE SERVIÇOS ANU
- Page 653 and 654: COMÉRCIOnANUÁRIO ESTATÍSTICO DO
- Page 655 and 656: ASPECTOS ESTRUTURAIS DO COMÉRCIO A
- Page 657 and 658: ASPECTOS ESTRUTURAIS DO COMÉRCIO A
- Page 659 and 660: INDICADORES CONJUNTURAIS DO COMÉRC
- Page 661 and 662: INDICADORES CONJUNTURAIS DO COMÉRC
- Page 663 and 664: INDICADORES CONJUNTURAIS DO COMÉRC
- Page 665 and 666: INDICADORES CONJUNTURAIS DO COMÉRC
- Page 667 and 668: INDICADORES CONJUNTURAIS DO COMÉRC
- Page 669 and 670: INDICADORES CONJUNTURAIS DO COMÉRC
- Page 672 and 673: ANUÁRIO ESTATÍSTICO DO BRASIL - 1
- Page 674 and 675: ANUÁRIO ESTATÍSTICO DO BRASIL - 1
- Page 676 and 677: ANUÁRIO ESTATÍSTICO DO BRASIL - 1
- Page 678 and 679: ANUÁRIO ESTATÍSTICO DO BRASIL - 1
- Page 680 and 681: ANUÁRIO ESTATÍSTICO DO BRASIL - 1
- Page 682 and 683:
ANUÁRIO ESTATÍSTICO DO BRASIL - 1
- Page 684 and 685:
ANUÁRIO ESTATÍSTICO DO BRASIL - 1
- Page 686 and 687:
ANUÁRIO ESTATÍSTICO DO BRASIL - 1
- Page 688 and 689:
ANUÁRIO ESTATÍSTICO DO BRASIL - 1
- Page 690 and 691:
ANUÁRIO ESTATÍSTICO DO BRASIL - 1
- Page 692 and 693:
ANUÁRIO ESTATÍSTICO DO BRASIL - 1
- Page 694 and 695:
ANUÁRIO ESTATÍSTICO DO BRASIL - 1
- Page 696 and 697:
ANUÁRIO ESTATÍSTICO DO BRASIL - 1
- Page 698 and 699:
ANUÁRIO ESTATÍSTICO DO BRASIL - 1
- Page 700 and 701:
ANUÁRIO ESTATÍSTICO DO BRASIL - 1
- Page 702 and 703:
ANUÁRIO ESTATÍSTICO DO BRASIL - 1
- Page 704 and 705:
ANUÁRIO ESTATÍSTICO DO BRASIL - 1
- Page 706 and 707:
ANUÁRIO ESTATÍSTICO DO BRASIL - 1
- Page 708 and 709:
ANUÁRIO ESTATÍSTICO DO BRASIL - 1
- Page 710 and 711:
ANUÁRIO ESTATÍSTICO DO BRASIL - 1
- Page 713 and 714:
ANUÁRIO ESTATÍSTICO DO BRASIL - 1
- Page 715 and 716:
ANUÁRIO ESTATÍSTICO DO BRASIL - 1
- Page 717 and 718:
ANUÁRIO ESTATÍSTICO DO BRASIL - 1
- Page 719 and 720:
ANUÁRIO ESTATÍSTICO DO BRASIL - 1
- Page 721 and 722:
ANUÁRIO ESTATÍSTICO DO BRASIL - 1
- Page 723 and 724:
ANUÁRIO ESTATÍSTICO DO BRASIL - 1
- Page 726 and 727:
ANUÁRIO ESTATÍSTICO DO BRASIL - 1
- Page 728 and 729:
ANUÁRIO ESTATÍSTICO DO BRASIL - 1
- Page 730 and 731:
ANUÁRIO ESTATÍSTICO DO BRASIL - 1
- Page 732 and 733:
ANUÁRIO ESTATÍSTICO DO BRASIL - 1
- Page 734 and 735:
ANUÁRIO ESTATÍSTICO DO BRASIL - 1
- Page 736 and 737:
ANUÁRIO ESTATÍSTICO DO BRASIL - 1
- Page 738 and 739:
GLOSSÁRIO ANUÁRIO ESTATÍSTICO DO
- Page 740 and 741:
ANUÁRIO ESTATÍSTICO DO BRASIL - 1
- Page 742:
ANUÁRIO ESTATÍSTICO DO BRASIL - 1
- Page 745:
ÍNDICES, PREÇOS, CUSTOS E SALÁRI
- Page 748 and 749:
ÍNDICESdANUÁRIO ESTATÍSTICO DO B
- Page 750 and 751:
ÍNDICESdANUÁRIO ESTATÍSTICO DO B
- Page 752 and 753:
ÍNDICES ANUÁRIO ESTATÍSTICO DO B
- Page 754 and 755:
ÍNDICES DE PREÇOS ANUÁRIO ESTAT
- Page 756 and 757:
ÍNDICES DE PREÇOS ANUÁRIO ESTAT
- Page 758 and 759:
ÍNDICES DE PREÇOS ANUÁRIO ESTAT
- Page 760 and 761:
ÍNDICES DE PREÇOS ANUÁRIO ESTAT
- Page 762 and 763:
ÍNDICES DE PREÇOS ANUÁRIO ESTAT
- Page 764 and 765:
ÍNDICES DE PREÇOS ANUÁRIO ESTAT
- Page 766 and 767:
ÍNDICES DA CONSTRUÇÃO ANUÁRIO E
- Page 768 and 769:
ÍNDICES DA CONSTRUÇÃO ANUÁRIO E
- Page 770 and 771:
ÍNDICES DA CONSTRUÇÃO ANUÁRIO E
- Page 772 and 773:
ÍNDICES DA CONSTRUÇÃO ANUÁRIO E
- Page 774 and 775:
ÍNDICES NA FONTE DA PRODUÇÃO AGR
- Page 776 and 777:
ÍNDICES NA FONTE DA PRODUÇÃO AGR
- Page 778 and 779:
ÍNDICES NA FONTE DA PRODUÇÃO AGR
- Page 780 and 781:
ÍNDICES NA FONTE DA PRODUÇÃO AGR
- Page 782:
ÍNDICES NA FONTE DA PRODUÇÃO AGR
- Page 785 and 786:
PREÇOS, CUSTOS E SALÁRIOS ANUÁRI
- Page 787 and 788:
PREÇOS E CUSTOS ANUÁRIO ESTATÍST
- Page 789 and 790:
PREÇOS E CUSTOS ANUÁRIO ESTATÍST
- Page 791 and 792:
PREÇOS E CUSTOS ANUÁRIO ESTATÍST
- Page 793 and 794:
SALÁRIOS ANUÁRIO ESTATÍSTICO DO
- Page 795 and 796:
GLOSSÁRIO ANUÁRIO ESTATÍSTICO DO
- Page 797 and 798:
GLOSSÁRIO BIBLIOGRAFIA ANUÁRIO ES
- Page 799 and 800:
SUMÁRIO DAS SEÇÕES ANUÁRIO ESTA
- Page 801:
SUMÁRIO DAS SEÇÕES ANUÁRIO ESTA
- Page 804:
AGREGADOS MACROECONÔMICOS ANUÁRIO
- Page 807 and 808:
RECEITA E DESPESA DA UNIÃO ANUÁRI
- Page 809 and 810:
RECEITA E DESPESA DA UNIÃO ANUÁRI
- Page 811 and 812:
RECEITA E DESPESA DA UNIÃO ANUÁRI
- Page 813 and 814:
RECEITA E DESPESA DA UNIÃO ANUÁRI
- Page 815:
RECEITA E DESPESA DA UNIÃO ANUÁRI
- Page 818 and 819:
DESPESA COM PESSOAL ANUÁRIO ESTAT
- Page 820 and 821:
SERVIDORES ANUÁRIO ESTATÍSTICO DO
- Page 823 and 824:
ANUÁRIO ESTATÍSTICO DO BRASIL - 1
- Page 825 and 826:
ANUÁRIO ESTATÍSTICO DO BRASIL - 1
- Page 827 and 828:
ANUÁRIO ESTATÍSTICO DO BRASIL - 1
- Page 829 and 830:
ANUÁRIO ESTATÍSTICO DO BRASIL - 1
- Page 831 and 832:
ANUÁRIO ESTATÍSTICO DO BRASIL - 1
- Page 833 and 834:
ANUÁRIO ESTATÍSTICO DO BRASIL - 1
- Page 835 and 836:
ANUÁRIO ESTATÍSTICO DO BRASIL - 1
- Page 837 and 838:
ANUÁRIO ESTATÍSTICO DO BRASIL - 1
- Page 839 and 840:
ANUÁRIO ESTATÍSTICO DO BRASIL - 1
- Page 841 and 842:
ANUÁRIO ESTATÍSTICO DO BRASIL - 1
- Page 843 and 844:
ANUÁRIO ESTATÍSTICO DO BRASIL - 1
- Page 845 and 846:
ANUÁRIO ESTATÍSTICO DO BRASIL - 1
- Page 847 and 848:
ANUÁRIO ESTATÍSTICO DO BRASIL - 1
- Page 850 and 851:
ANUÁRIO ESTATÍSTICO DO BRASIL - 1
- Page 852 and 853:
ANUÁRIO ESTATÍSTICO DO BRASIL - 1
- Page 854 and 855:
ANUÁRIO ESTATÍSTICO DO BRASIL - 1
- Page 856 and 857:
ANUÁRIO ESTATÍSTICO DO BRASIL - 1
- Page 858 and 859:
ANUÁRIO ESTATÍSTICO DO BRASIL - 1
- Page 860 and 861:
ANUÁRIO ESTATÍSTICO DO BRASIL - 1
- Page 862 and 863:
ANUÁRIO ESTATÍSTICO DO BRASIL - 1
- Page 864 and 865:
ANUÁRIO ESTATÍSTICO DO BRASIL - 1
- Page 866 and 867:
ANUÁRIO ESTATÍSTICO DO BRASIL - 1
- Page 868 and 869:
ANUÁRIO ESTATÍSTICO DO BRASIL - 1
- Page 870 and 871:
ANUÁRIO ESTATÍSTICO DO BRASIL - 1
- Page 872 and 873:
ANUÁRIO ESTATÍSTICO DO BRASIL - 1
- Page 874 and 875:
ANUÁRIO ESTATÍSTICO DO BRASIL - 1
- Page 876:
ANUÁRIO ESTATÍSTICO DO BRASIL - 1
- Page 879 and 880:
CONTAS NACIONAIS ANUÁRIO ESTATÍST
- Page 881 and 882:
SISTEMA DE CONTAS NACIONAIS ANUÁRI
- Page 883 and 884:
SISTEMA DE CONTAS NACIONAIS ANUÁRI
- Page 885 and 886:
SISTEMA DE CONTAS NACIONAIS ANUÁRI
- Page 887 and 888:
SISTEMA DE CONTAS NACIONAIS ANUÁRI
- Page 889 and 890:
GLOSSÁRIO ANUÁRIO ESTATÍSTICO DO