team spirit - Bankier.pl
team spirit - Bankier.pl
team spirit - Bankier.pl

You also want an ePaper? Increase the reach of your titles
YUMPU automatically turns print PDFs into web optimized ePapers that Google loves.
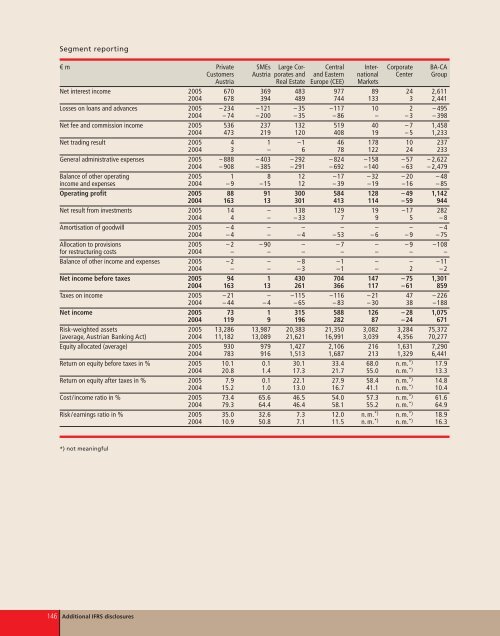
Segment reporting<br />
€ m Private SMEs Large Cor- Central Inter- Corporate BA-CA<br />
Customers Austria porates and and Eastern national Center Group<br />
Austria Real Estate Europe (CEE) Markets<br />
Net interest income 2005 670 369 483 977 89 24 2,611<br />
2004 678 394 489 744 133 3 2,441<br />
Losses on loans and advances 2005 – 234 –121 – 35 –117 10 2 – 495<br />
2004 – 74 – 200 – 35 – 86 – – 3 – 398<br />
Net fee and commission income 2005 536 237 132 519 40 – 7 1,458<br />
2004 473 219 120 408 19 – 5 1,233<br />
Net trading result 2005 4 1 –1 46 178 10 237<br />
2004 3 – 6 78 122 24 233<br />
General administrative expenses 2005 – 888 – 403 – 292 – 824 –158 – 57 – 2,622<br />
2004 – 908 – 385 – 291 – 692 –140 – 63 – 2,479<br />
Balance of other operating 2005 1 8 12 –17 – 32 – 20 – 48<br />
income and expenses 2004 – 9 –15 12 – 39 –19 –16 – 85<br />
Operating profit 2005 88 91 300 584 128 – 49 1,142<br />
2004 163 13 301 413 114 – 59 944<br />
Net result from investments 2005 14 – 138 129 19 –17 282<br />
2004 4 – – 33 7 9 5 – 8<br />
Amortisation of goodwill 2005 – 4 – – – – – – 4<br />
2004 – 4 – – 4 – 53 – 6 – 9 – 75<br />
Allocation to provisions 2005 – 2 – 90 – – 7 – – 9 –108<br />
for restructuring costs 2004 – – – – – – –<br />
Balance of other income and expenses 2005 – 2 – – 8 –1 – – –11<br />
2004 – – – 3 –1 – 2 – 2<br />
Net income before taxes 2005 94 1 430 704 147 – 75 1,301<br />
2004 163 13 261 366 117 – 61 859<br />
Taxes on income 2005 – 21 – –115 –116 – 21 47 – 226<br />
2004 – 44 – 4 – 65 – 83 – 30 38 –188<br />
Net income 2005 73 1 315 588 126 – 28 1,075<br />
2004 119 9 196 282 87 – 24 671<br />
Risk-weighted assets 2005 13,286 13,987 20,383 21,350 3,082 3,284 75,372<br />
(average, Austrian Banking Act) 2004 11,182 13,089 21,621 16,991 3,039 4,356 70,277<br />
Equity allocated (average) 2005 930 979 1,427 2,106 216 1,631 7,290<br />
2004 783 916 1,513 1,687 213 1,329 6,441<br />
Return on equity before taxes in % 2005 10.1 0.1 30.1 33.4 68.0 n.m. *) 17.9<br />
2004 20.8 1.4 17.3 21.7 55.0 n.m. *) 13.3<br />
Return on equity after taxes in % 2005 7.9 0.1 22.1 27.9 58.4 n.m. *) 14.8<br />
2004 15.2 1.0 13.0 16.7 41.1 n.m. *) 10.4<br />
Cost/income ratio in % 2005 73.4 65.6 46.5 54.0 57.3 n.m. *) 61.6<br />
2004 79.3 64.4 46.4 58.1 55.2 n.m. *) 64.9<br />
Risk/earnings ratio in % 2005 35.0 32.6 7.3 12.0 n.m. *) n.m. *) 18.9<br />
2004 10.9 50.8 7.1 11.5 n.m. *) n.m. *) 16.3<br />
*) not meaningful<br />
146 Additional IFRS disclosures