team spirit - Bankier.pl
team spirit - Bankier.pl
team spirit - Bankier.pl

You also want an ePaper? Increase the reach of your titles
YUMPU automatically turns print PDFs into web optimized ePapers that Google loves.
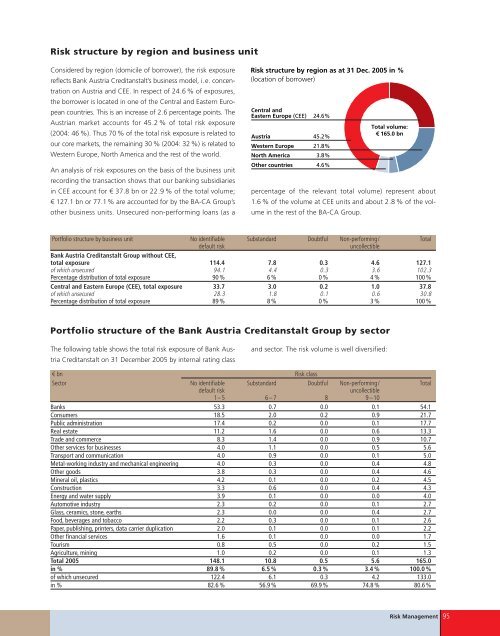
Risk structure by region and business unit<br />
Considered by region (domicile of borrower), the risk exposure<br />
reflects Bank Austria Creditanstalt’s business model, i.e. concentration<br />
on Austria and CEE. In respect of 24.6 % of exposures,<br />
the borrower is located in one of the Central and Eastern European<br />
countries. This is an increase of 2.6 percentage points. The<br />
Austrian market accounts for 45.2 % of total risk exposure<br />
(2004: 46 %). Thus 70 % of the total risk exposure is related to<br />
our core markets, the remaining 30 % (2004: 32 %) is related to<br />
Western Europe, North America and the rest of the world.<br />
An analysis of risk exposures on the basis of the business unit<br />
recording the transaction shows that our banking subsidiaries<br />
in CEE account for € 37.8 bn or 22.9 % of the total volume;<br />
€ 127.1 bn or 77.1% are accounted for by the BA-CA Group’s<br />
other business units. Unsecured non-performing loans (as a<br />
Risk structure by region as at 31 Dec. 2005 in %<br />
(location of borrower)<br />
Central and<br />
Eastern Europe (CEE) 24.6%<br />
Austria 45.2%<br />
Western Europe 21.8%<br />
North America 3.8%<br />
Other countries 4.6%<br />
Total volume:<br />
€ 165.0 bn<br />
percentage of the relevant total volume) represent about<br />
1.6 % of the volume at CEE units and about 2.8 % of the volume<br />
in the rest of the BA-CA Group.<br />
Portfolio structure by business unit No identifiable Substandard Doubtful Non-performing/ Total<br />
default risk uncollectible<br />
Bank Austria Creditanstalt Group without CEE,<br />
total exposure 114.4 7.8 0.3 4.6 127.1<br />
of which unsecured 94.1 4.4 0.3 3.6 102.3<br />
Percentage distribution of total exposure 90 % 6 % 0 % 4 % 100 %<br />
Central and Eastern Europe (CEE), total exposure 33.7 3.0 0.2 1.0 37.8<br />
of which unsecured 28.3 1.8 0.1 0.6 30.8<br />
Percentage distribution of total exposure 89 % 8 % 0 % 3 % 100 %<br />
Portfolio structure of the Bank Austria Creditanstalt Group by sector<br />
The following table shows the total risk exposure of Bank Austria<br />
Creditanstalt on 31 December 2005 by internal rating class<br />
and sector. The risk volume is well diversified:<br />
€bn Risk class<br />
Sector No identifiable Substandard Doubtful Non-performing/ Total<br />
default risk uncollectible<br />
1–5 6–7 8 9–10<br />
Banks 53.3 0.7 0.0 0.1 54.1<br />
Consumers 18.5 2.0 0.2 0.9 21.7<br />
Public administration 17.4 0.2 0.0 0.1 17.7<br />
Real estate 11.2 1.6 0.0 0.6 13.3<br />
Trade and commerce 8.3 1.4 0.0 0.9 10.7<br />
Other services for businesses 4.0 1.1 0.0 0.5 5.6<br />
Transport and communication 4.0 0.9 0.0 0.1 5.0<br />
Metal-working industry and mechanical engineering 4.0 0.3 0.0 0.4 4.8<br />
Other goods 3.8 0.3 0.0 0.4 4.6<br />
Mineral oil, <strong>pl</strong>astics 4.2 0.1 0.0 0.2 4.5<br />
Construction 3.3 0.6 0.0 0.4 4.3<br />
Energy and water sup<strong>pl</strong>y 3.9 0.1 0.0 0.0 4.0<br />
Automotive industry 2.3 0.2 0.0 0.1 2.7<br />
Glass, ceramics, stone, earths 2.3 0.0 0.0 0.4 2.7<br />
Food, beverages and tobacco 2.2 0.3 0.0 0.1 2.6<br />
Paper, publishing, printers, data carrier du<strong>pl</strong>ication 2.0 0.1 0.0 0.1 2.2<br />
Other financial services 1.6 0.1 0.0 0.0 1.7<br />
Tourism 0.8 0.5 0.0 0.2 1.5<br />
Agriculture, mining 1.0 0.2 0.0 0.1 1.3<br />
Total 2005 148.1 10.8 0.5 5.6 165.0<br />
in % 89.8 % 6.5 % 0.3 % 3.4 % 100.0 %<br />
of which unsecured 122.4 6.1 0.3 4.2 133.0<br />
in % 82.6 % 56.9 % 69.9 % 74.8 % 80.6 %<br />
Risk Management 95