team spirit - Bankier.pl
team spirit - Bankier.pl
team spirit - Bankier.pl

Create successful ePaper yourself
Turn your PDF publications into a flip-book with our unique Google optimized e-Paper software.
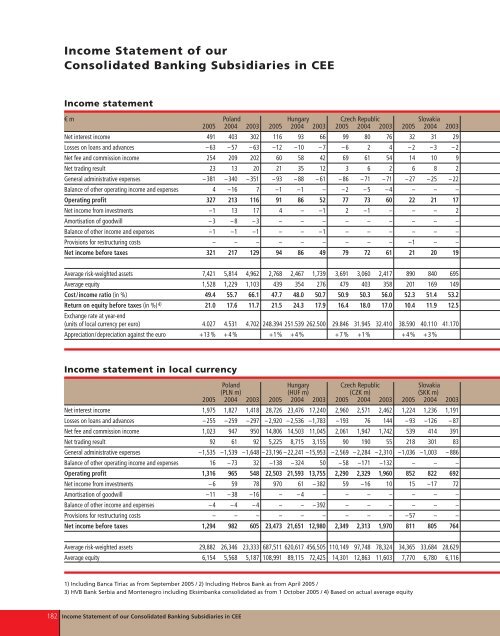
Income Statement of our<br />
Consolidated Banking Subsidiaries in CEE<br />
Income statement<br />
€ m Poland Hungary Czech Republic Slovakia<br />
2005 2004 2003 2005 2004 2003 2005 2004 2003 2005 2004 2003<br />
Net interest income 491 403 302 116 93 66 99 80 76 32 31 29<br />
Losses on loans and advances – 63 – 57 – 63 –12 –10 – 7 – 6 2 4 – 2 – 3 – 2<br />
Net fee and commission income 254 209 202 60 58 42 69 61 54 14 10 9<br />
Net trading result 23 13 20 21 35 12 3 6 2 6 8 2<br />
General administrative expenses – 381 – 340 – 351 – 93 – 88 – 61 – 86 – 71 – 71 – 27 – 25 – 22<br />
Balance of other operating income and expenses 4 –16 7 –1 –1 – – 2 – 5 – 4 – – –<br />
Operating profit 327 213 116 91 86 52 77 73 60 22 21 17<br />
Net income from investments –1 13 17 4 – –1 2 –1 – – – 2<br />
Amortisation of goodwill – 3 – 8 – 3 – – – – – – – – –<br />
Balance of other income and expenses –1 –1 –1 – – –1 – – – – – –<br />
Provisions for restructuring costs – – – – – – – – – –1 – –<br />
Net income before taxes 321 217 129 94 86 49 79 72 61 21 20 19<br />
Average risk-weighted assets 7,421 5,814 4,962 2,768 2,467 1,739 3,691 3,060 2,417 890 840 695<br />
Average equity 1,528 1,229 1,103 439 354 276 479 403 358 201 169 149<br />
Cost/income ratio (in %) 49.4 55.7 66.1 47.7 48.0 50.7 50.9 50.3 56.0 52.3 51.4 53.2<br />
Return on equity before taxes (in %) 4) Exchange rate at year-end<br />
21.0 17.6 11.7 21.5 24.3 17.9 16.4 18.0 17.0 10.4 11.9 12.5<br />
(units of local currency per euro) 4.027 4.531 4.702 248.394 251.539 262.500 29.846 31.945 32.410 38.590 40.110 41.170<br />
Appreciation/depreciation against the euro +13 % + 4 % +1% + 4 % + 7 % +1% + 4 % + 3 %<br />
Income statement in local currency<br />
Poland Hungary Czech Republic Slovakia<br />
(PLN m) (HUF m) (CZK m) (SKK m)<br />
2005 2004 2003 2005 2004 2003 2005 2004 2003 2005 2004 2003<br />
Net interest income 1,975 1,827 1,418 28,726 23,476 17,240 2,960 2,571 2,462 1,224 1,236 1,191<br />
Losses on loans and advances – 255 – 259 – 297 – 2,920 – 2,536 –1,783 –193 76 144 – 93 –126 – 87<br />
Net fee and commission income 1,023 947 950 14,806 14,503 11,045 2,061 1,947 1,742 539 414 391<br />
Net trading result 92 61 92 5,225 8,715 3,155 90 190 55 218 301 83<br />
General administrative expenses –1,535 –1,539 –1,648 – 23,196 – 22,241 –15,953 – 2,569 – 2,284 – 2,310 –1,036 –1,003 – 886<br />
Balance of other operating income and expenses 16 – 73 32 –138 – 324 50 – 58 –171 –132 – – –<br />
Operating profit 1,316 965 548 22,503 21,593 13,755 2,290 2,329 1,960 852 822 692<br />
Net income from investments – 6 59 78 970 61 – 382 59 –16 10 15 –17 72<br />
Amortisation of goodwill –11 – 38 –16 – – 4 – – – – – – –<br />
Balance of other income and expenses – 4 – 4 – 4 – – – 392 – – – – – –<br />
Provisions for restructuring costs – – – – – – – – – – 57 – –<br />
Net income before taxes 1,294 982 605 23,473 21,651 12,980 2,349 2,313 1,970 811 805 764<br />
Average risk-weighted assets 29,882 26,346 23,333 687,511 620,617 456,505 110,149 97,748 78,324 34,365 33,684 28,629<br />
Average equity 6,154 5,568 5,187 108,991 89,115 72,425 14,301 12,863 11,603 7,770 6,780 6,116<br />
1) Including Banca Tiriac as from September 2005 / 2) Including Hebros Bank as from April 2005 /<br />
3) HVB Bank Serbia and Montenegro including Eksimbanka consolidated as from 1 October 2005 / 4) Based on actual average equity<br />
182 Income Statement of our Consolidated Banking Subsidiaries in CEE