team spirit - Bankier.pl
team spirit - Bankier.pl
team spirit - Bankier.pl

You also want an ePaper? Increase the reach of your titles
YUMPU automatically turns print PDFs into web optimized ePapers that Google loves.
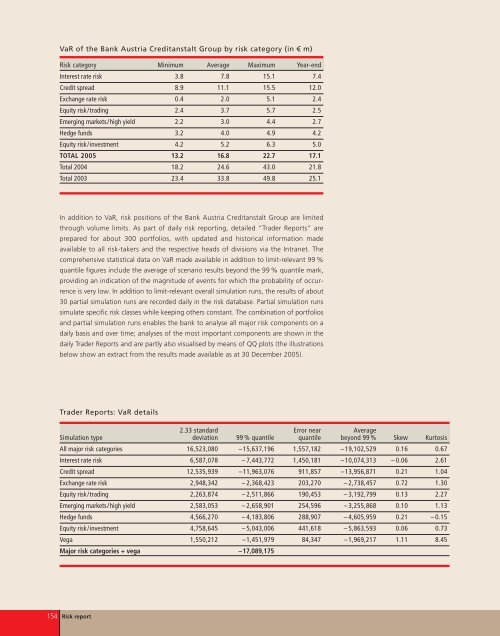
VaR of the Bank Austria Creditanstalt Group by risk category (in € m)<br />
Risk category Minimum Average Maximum Year-end<br />
Interest rate risk 3.8 7.8 15.1 7.4<br />
Credit spread 8.9 11.1 15.5 12.0<br />
Exchange rate risk 0.4 2.0 5.1 2.4<br />
Equity risk/trading 2.4 3.7 5.7 2.5<br />
Emerging markets/high yield 2.2 3.0 4.4 2.7<br />
Hedge funds 3.2 4.0 4.9 4.2<br />
Equity risk/investment 4.2 5.2 6.3 5.0<br />
TOTAL 2005 13.2 16.8 22.7 17.1<br />
Total 2004 18.2 24.6 43.0 21.8<br />
Total 2003 23.4 33.8 49.8 25.1<br />
In addition to VaR, risk positions of the Bank Austria Creditanstalt Group are limited<br />
through volume limits. As part of daily risk reporting, detailed “Trader Reports” are<br />
prepared for about 300 portfolios, with updated and historical information made<br />
available to all risk-takers and the respective heads of divisions via the Intranet. The<br />
comprehensive statistical data on VaR made available in addition to limit-relevant 99 %<br />
quantile figures include the average of scenario results beyond the 99 % quantile mark,<br />
providing an indication of the magnitude of events for which the probability of occurrence<br />
is very low. In addition to limit-relevant overall simulation runs, the results of about<br />
30 partial simulation runs are recorded daily in the risk database. Partial simulation runs<br />
simulate specific risk classes while keeping others constant. The combination of portfolios<br />
and partial simulation runs enables the bank to analyse all major risk components on a<br />
daily basis and over time; analyses of the most important components are shown in the<br />
daily Trader Reports and are partly also visualised by means of QQ <strong>pl</strong>ots (the illustrations<br />
below show an extract from the results made available as at 30 December 2005).<br />
Trader Reports: VaR details<br />
2.33 standard Error near Average<br />
Simulation type deviation 99 % quantile quantile beyond 99 % Skew Kurtosis<br />
All major risk categories 16,523,080 –15,637,196 1,557,182 –19,102,529 0.16 0.67<br />
Interest rate risk 6,587,078 – 7,443,772 1,450,181 –10,074,313 – 0.06 2.61<br />
Credit spread 12,535,939 –11,963,076 911,857 –13,956,871 0.21 1.04<br />
Exchange rate risk 2,948,342 – 2,368,423 203,270 – 2,738,457 0.72 1.30<br />
Equity risk/trading 2,263,874 – 2,511,866 190,453 – 3,192,799 0.13 2.27<br />
Emerging markets/high yield 2,583,053 – 2,658,901 254,596 – 3,255,868 0.10 1.13<br />
Hedge funds 4,566,270 – 4,183,806 288,907 – 4,605,959 0.21 – 0.15<br />
Equity risk/investment 4,758,645 – 5,043,006 441,618 – 5,863,593 0.06 0.73<br />
Vega 1,550,212 –1,451,979 84,347 –1,969,217 1.11 8.45<br />
Major risk categories + vega –17,089,175<br />
154 Risk report