team spirit - Bankier.pl
team spirit - Bankier.pl
team spirit - Bankier.pl

You also want an ePaper? Increase the reach of your titles
YUMPU automatically turns print PDFs into web optimized ePapers that Google loves.
Net trading result<br />
€ m 2005 2004 2003 2002 2001<br />
237 233 220 231 261<br />
In this environment, BA-CA demonstrated its expertise and<br />
achieved a net trading result of € 237 m, exceeding the high<br />
figure of the previous year by 2 %. The contribution from<br />
BA-CA Cayman, which is part of the Corporate Center segment,<br />
was positive, though slightly lower than in the previous<br />
year. Quite generally, 2005 was characterised by a belowaverage<br />
performance of the hedge fund industry, especially<br />
convertible arbitrage strategies.<br />
� General administrative expenses rose by € 143 m or 6 %<br />
to € 2,622 m in 2005. Costs again rose at a slower pace than<br />
revenues, reflecting a further improvement in productivity.<br />
Almost all of the increase in general administrative expenses<br />
was recorded in the CEE business segment (up by € 132 m or<br />
19 %). In this segment, exchange rate effects amounted to<br />
€ 55 m and changes in the group of consolidated companies<br />
accounted for € 41 m. Adjusted for exchange rate effects and<br />
additions to and disposals of consolidated companies, general<br />
administrative expenses in the CEE segment increased by € 35 m<br />
or 5 %. Total costs in the other business segments rose by only<br />
1%; in the three Austrian customer business segments, general<br />
administrative expenses remained unchanged. The 2005<br />
income statement reflects a special expense of € 23 m related<br />
to the integration into UniCredit Group.<br />
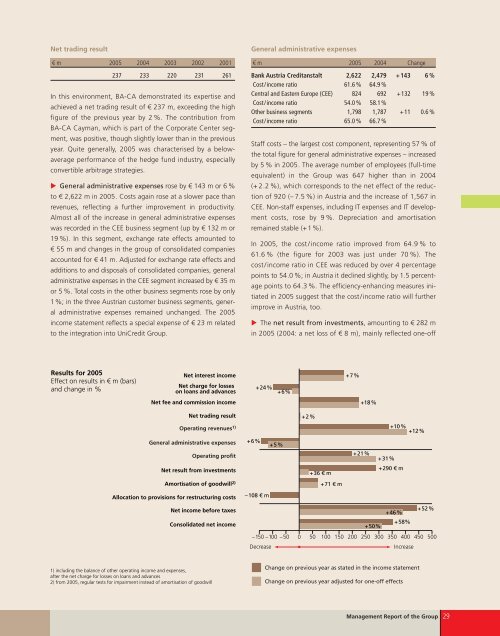
Results for 2005<br />
Effect on results in € m (bars)<br />
and change in %<br />
Net interest income<br />
Net charge for losses<br />
on loans and advances<br />
Net fee and commission income<br />
Net trading result<br />
Operating revenues 1)<br />
General administrative expenses<br />
Operating profit<br />
Net result from investments<br />
Amortisation of goodwill 2)<br />
Allocation to provisions for restructuring costs<br />
Net income before taxes<br />
Consolidated net income<br />
1) including the balance of other operating income and expenses,<br />
after the net charge for losses on loans and advances<br />
2) from 2005, regular tests for impairment instead of amortisation of goodwill<br />
General administrative expenses<br />
€ m 2005 2004 Change<br />
Bank Austria Creditanstalt 2,622 2,479 +143 6 %<br />
Cost/income ratio 61.6 % 64.9 %<br />
Central and Eastern Europe (CEE) 824 692 +132 19 %<br />
Cost/income ratio 54.0 % 58.1%<br />
Other business segments 1,798 1,787 +11 0.6 %<br />
Cost/income ratio 65.0 % 66.7 %<br />
Staff costs – the largest cost component, representing 57 % of<br />
the total figure for general administrative expenses – increased<br />
by 5 % in 2005. The average number of em<strong>pl</strong>oyees (full-time<br />
equivalent) in the Group was 647 higher than in 2004<br />
(+ 2.2 %), which corresponds to the net effect of the reduction<br />
of 920 (– 7.5 %) in Austria and the increase of 1,567 in<br />
CEE. Non-staff expenses, including IT expenses and IT development<br />
costs, rose by 9 %. Depreciation and amortisation<br />
remained stable (+1%).<br />
In 2005, the cost/income ratio improved from 64.9 % to<br />
61.6 % (the figure for 2003 was just under 70 %). The<br />
cost/income ratio in CEE was reduced by over 4 percentage<br />
points to 54.0 %; in Austria it declined slightly, by 1.5 percentage<br />
points to 64.3 %. The efficiency-enhancing measures initiated<br />
in 2005 suggest that the cost/income ratio will further<br />
improve in Austria, too.<br />
� The net result from investments, amounting to € 282 m<br />
in 2005 (2004: a net loss of € 8 m), mainly reflected one-off<br />
+6%<br />
+24%<br />
–108 € m<br />
+5%<br />
+6%<br />
+2%<br />
+36 € m<br />
+71 € m<br />
+7%<br />
+18%<br />
+21%<br />
+31%<br />
+290 € m<br />
+10%<br />
+12%<br />
+46%<br />
+58%<br />
+50%<br />
–150 –100 –50 0 50 100 150 200 250 300 350 400 450 500<br />
Decrease Increase<br />
Change on previous year as stated in the income statement<br />
Change on previous year adjusted for one-off effects<br />
+52%<br />
Management Report of the Group 29