

Transportation energy data book: edition 23 - Oak Ridge National ...
Transportation energy data book: edition 23 - Oak Ridge National ...
Transportation energy data book: edition 23 - Oak Ridge National ...

Create successful ePaper yourself
Turn your PDF publications into a flip-book with our unique Google optimized e-Paper software.
8–2<br />
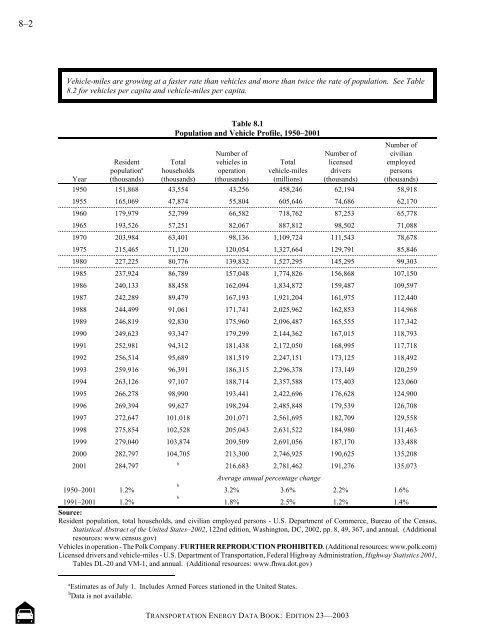
Vehicle-miles are growing at a faster rate than vehicles and more than twice the rate of population. See Table<br />
8.2 for vehicles per capita and vehicle-miles per capita.<br />
a Estimates as of July 1. Includes Armed Forces stationed in the United States.<br />
b Data is not available.<br />
Table 8.1<br />
Population and Vehicle Profile, 1950–2001<br />
Resident<br />
population<br />
Year<br />
a<br />
Number of<br />
Number of<br />
Number of<br />
civilian<br />
Total vehicles in Total licensed employed<br />
households operation vehicle-miles drivers<br />
persons<br />
(thousands) (thousands) (thousands) (millions) (thousands) (thousands)<br />
1950 151,868 43,554 43,256 458,246 62,194 58,918<br />
1955 165,069 47,874 55,804 605,646 74,686 62,170<br />
1960 179,979 52,799 66,582 718,762 87,253 65,778<br />
1965 193,526 57,251 82,067 887,812 98,502 71,088<br />
1970 203,984 63,401 98,136 1,109,724 111,543 78,678<br />
1975 215,465 71,120 120,054 1,327,664 129,791 85,846<br />
1980 227,225 80,776 139,832 1,527,295 145,295 99,303<br />
1985 <strong>23</strong>7,924 86,789 157,048 1,774,826 156,868 107,150<br />
1986 240,133 88,458 162,094 1,834,872 159,487 109,597<br />
1987 242,289 89,479 167,193 1,921,204 161,975 112,440<br />
1988 244,499 91,061 171,741 2,025,962 162,853 114,968<br />
1989 246,819 92,830 175,960 2,096,487 165,555 117,342<br />
1990 249,6<strong>23</strong> 93,347 179,299 2,144,362 167,015 118,793<br />
1991 252,981 94,312 181,438 2,172,050 168,995 117,718<br />
1992 256,514 95,689 181,519 2,247,151 173,125 118,492<br />
1993 259,916 96,391 186,315 2,296,378 173,149 120,259<br />
1994 263,126 97,107 188,714 2,357,588 175,403 1<strong>23</strong>,060<br />
1995 266,278 98,990 193,441 2,422,696 176,628 124,900<br />
1996 269,394 99,627 198,294 2,485,848 179,539 126,708<br />
1997 272,647 101,018 201,071 2,561,695 182,709 129,558<br />
1998 275,854 102,528 205,043 2,631,522 184,980 131,463<br />
1999 279,040 103,874 209,509 2,691,056 187,170 133,488<br />
2000 282,797 104,705 213,300 2,746,925 190,625 135,208<br />
2001 284,797 b 216,683 2,781,462 191,276 135,073<br />
Average annual percentage change<br />
1950–2001 1.2%<br />
b<br />
3.2% 3.6% 2.2% 1.6%<br />
1991–2001<br />
Source:<br />
1.2%<br />
b<br />
1.8% 2.5% 1.2% 1.4%<br />
Resident population, total households, and civilian employed persons - U.S. Department of Commerce, Bureau of the Census,<br />
Statistical Abstract of the United States–2002, 122nd <strong>edition</strong>, Washington, DC, 2002, pp. 8, 49, 367, and annual. (Additional<br />
resources: www.census.gov)<br />
Vehicles in operation - The Polk Company. FURTHER REPRODUCTION PROHIBITED. (Additional resources: www.polk.com)<br />
Licensed drivers and vehicle-miles - U.S. Department of <strong>Transportation</strong>, Federal Highway Administration, Highway Statistics 2001,<br />
Tables DL-20 and VM-1, and annual. (Additional resources: www.fhwa.dot.gov)<br />
TRANSPORTATION ENERGY DATA BOOK: EDITION <strong>23</strong>—2003


