

Transportation energy data book: edition 23 - Oak Ridge National ...
Transportation energy data book: edition 23 - Oak Ridge National ...
Transportation energy data book: edition 23 - Oak Ridge National ...

You also want an ePaper? Increase the reach of your titles
YUMPU automatically turns print PDFs into web optimized ePapers that Google loves.
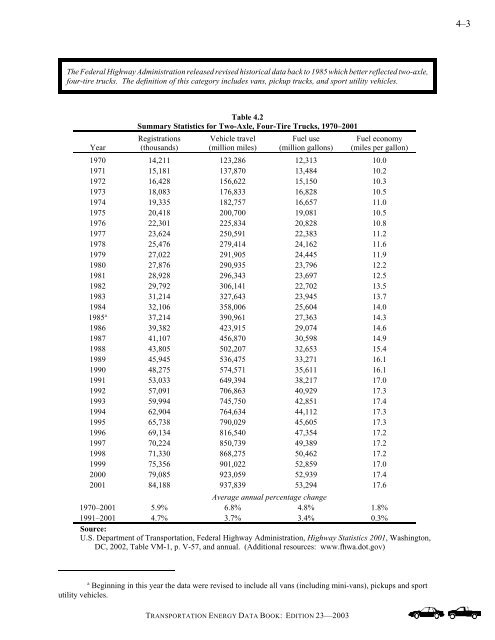
The Federal Highway Administration released revised historical <strong>data</strong> back to 1985 which better reflected two-axle,<br />
four-tire trucks. The definition of this category includes vans, pickup trucks, and sport utility vehicles.<br />
Year<br />
utility vehicles.<br />
Table 4.2<br />
Summary Statistics for Two-Axle, Four-Tire Trucks, 1970–2001<br />
Registrations<br />
(thousands)<br />
Vehicle travel<br />
(million miles)<br />
Fuel use<br />
(million gallons)<br />
a Beginning in this year the <strong>data</strong> were revised to include all vans (including mini-vans), pickups and sport<br />
TRANSPORTATION ENERGY DATA BOOK: EDITION <strong>23</strong>—2003<br />
Fuel economy<br />
(miles per gallon)<br />
1970 14,211 1<strong>23</strong>,286 12,313 10.0<br />
1971 15,181 137,870 13,484 10.2<br />
1972 16,428 156,622 15,150 10.3<br />
1973 18,083 176,833 16,828 10.5<br />
1974 19,335 182,757 16,657 11.0<br />
1975 20,418 200,700 19,081 10.5<br />
1976 22,301 225,834 20,828 10.8<br />
1977 <strong>23</strong>,624 250,591 22,383 11.2<br />
1978 25,476 279,414 24,162 11.6<br />
1979 27,022 291,905 24,445 11.9<br />
1980 27,876 290,935 <strong>23</strong>,796 12.2<br />
1981 28,928 296,343 <strong>23</strong>,697 12.5<br />
1982 29,792 306,141 22,702 13.5<br />
1983 31,214 327,643 <strong>23</strong>,945 13.7<br />
1984 32,106 358,006 25,604 14.0<br />
1985a 37,214 390,961 27,363 14.3<br />
1986 39,382 4<strong>23</strong>,915 29,074 14.6<br />
1987 41,107 456,870 30,598 14.9<br />
1988 43,805 502,207 32,653 15.4<br />
1989 45,945 536,475 33,271 16.1<br />
1990 48,275 574,571 35,611 16.1<br />
1991 53,033 649,394 38,217 17.0<br />
1992 57,091 706,863 40,929 17.3<br />
1993 59,994 745,750 42,851 17.4<br />
1994 62,904 764,634 44,112 17.3<br />
1995 65,738 790,029 45,605 17.3<br />
1996 69,134 816,540 47,354 17.2<br />
1997 70,224 850,739 49,389 17.2<br />
1998 71,330 868,275 50,462 17.2<br />
1999 75,356 901,022 52,859 17.0<br />
2000 79,085 9<strong>23</strong>,059 52,939 17.4<br />
2001 84,188 937,839 53,294 17.6<br />
Average annual percentage change<br />
1970–2001 5.9% 6.8% 4.8% 1.8%<br />
1991–2001<br />
Source:<br />
4.7% 3.7% 3.4% 0.3%<br />
U.S. Department of <strong>Transportation</strong>, Federal Highway Administration, Highway Statistics 2001, Washington,<br />
DC, 2002, Table VM-1, p. V-57, and annual. (Additional resources: www.fhwa.dot.gov)<br />
4–3


