

Transportation energy data book: edition 23 - Oak Ridge National ...
Transportation energy data book: edition 23 - Oak Ridge National ...
Transportation energy data book: edition 23 - Oak Ridge National ...

Create successful ePaper yourself
Turn your PDF publications into a flip-book with our unique Google optimized e-Paper software.
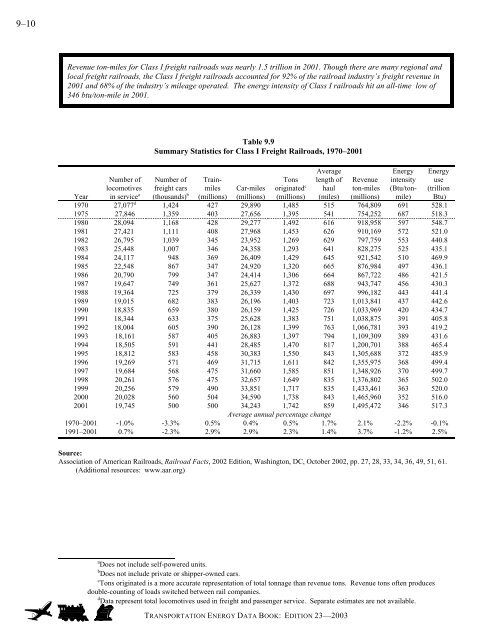
9–10<br />
Revenue ton-miles for Class I freight railroads was nearly 1.5 trillion in 2001. Though there are many regional and<br />
local freight railroads, the Class I freight railroads accounted for 92% of the railroad industry’s freight revenue in<br />
2001 and 68% of the industry’s mileage operated. The <strong>energy</strong> intensity of Class I railroads hit an all-time low of<br />
346 btu/ton-mile in 2001.<br />
Number of<br />
locomotives<br />
Table 9.9<br />
Summary Statistics for Class I Freight Railroads, 1970–2001<br />
Number of<br />
freight cars<br />
Trainmiles<br />
Tons<br />
originated c<br />
Average<br />
length of<br />
haul<br />
a Does not include self-powered units.<br />
b Does not include private or shipper-owned cars.<br />
c Tons originated is a more accurate representation of total tonnage than revenue tons. Revenue tons often produces<br />
double-counting of loads switched between rail companies.<br />
d Data represent total locomotives used in freight and passenger service. Separate estimates are not available.<br />
TRANSPORTATION ENERGY DATA BOOK: EDITION <strong>23</strong>—2003<br />
Revenue<br />
ton-miles<br />
Energy<br />
intensity<br />
(Btu/ton-<br />
Energy<br />
use<br />
(trillion<br />
Btu)<br />
Year in servicea (thousands) b (millions)<br />
Car-miles<br />
(millions) (millions) (miles) (millions) mile)<br />
1970 27,077d 1,424 427 29,890 1,485 515 764,809 691 528.1<br />
1975 27,846 1,359 403 27,656 1,395 541 754,252 687 518.3<br />
1980 28,094 1,168 428 29,277 1,492 616 918,958 597 548.7<br />
1981 27,421 1,111 408 27,968 1,453 626 910,169 572 521.0<br />
1982 26,795 1,039 345 <strong>23</strong>,952 1,269 629 797,759 553 440.8<br />
1983 25,448 1,007 346 24,358 1,293 641 828,275 525 435.1<br />
1984 24,117 948 369 26,409 1,429 645 921,542 510 469.9<br />
1985 22,548 867 347 24,920 1,320 665 876,984 497 436.1<br />
1986 20,790 799 347 24,414 1,306 664 867,722 486 421.5<br />
1987 19,647 749 361 25,627 1,372 688 943,747 456 430.3<br />
1988 19,364 725 379 26,339 1,430 697 996,182 443 441.4<br />
1989 19,015 682 383 26,196 1,403 7<strong>23</strong> 1,013,841 437 442.6<br />
1990 18,835 659 380 26,159 1,425 726 1,033,969 420 434.7<br />
1991 18,344 633 375 25,628 1,383 751 1,038,875 391 405.8<br />
1992 18,004 605 390 26,128 1,399 763 1,066,781 393 419.2<br />
1993 18,161 587 405 26,883 1,397 794 1,109,309 389 431.6<br />
1994 18,505 591 441 28,485 1,470 817 1,200,701 388 465.4<br />
1995 18,812 583 458 30,383 1,550 843 1,305,688 372 485.9<br />
1996 19,269 571 469 31,715 1,611 842 1,355,975 368 499.4<br />
1997 19,684 568 475 31,660 1,585 851 1,348,926 370 499.7<br />
1998 20,261 576 475 32,657 1,649 835 1,376,802 365 502.0<br />
1999 20,256 579 490 33,851 1,717 835 1,433,461 363 520.0<br />
2000 20,028 560 504 34,590 1,738 843 1,465,960 352 516.0<br />
2001 19,745 500 500 34,243 1,742 859 1,495,472 346 517.3<br />
Average annual percentage change<br />
1970–2001 -1.0% -3.3% 0.5% 0.4% 0.5% 1.7% 2.1% -2.2% -0.1%<br />
1991–2001 0.7% -2.3% 2.9% 2.9% 2.3% 1.4% 3.7% -1.2% 2.5%<br />
Source:<br />
Association of American Railroads, Railroad Facts, 2002 Edition, Washington, DC, October 2002, pp. 27, 28, 33, 34, 36, 49, 51, 61.<br />
(Additional resources: www.aar.org)


