

Transportation energy data book: edition 23 - Oak Ridge National ...
Transportation energy data book: edition 23 - Oak Ridge National ...
Transportation energy data book: edition 23 - Oak Ridge National ...

You also want an ePaper? Increase the reach of your titles
YUMPU automatically turns print PDFs into web optimized ePapers that Google loves.
4–6<br />
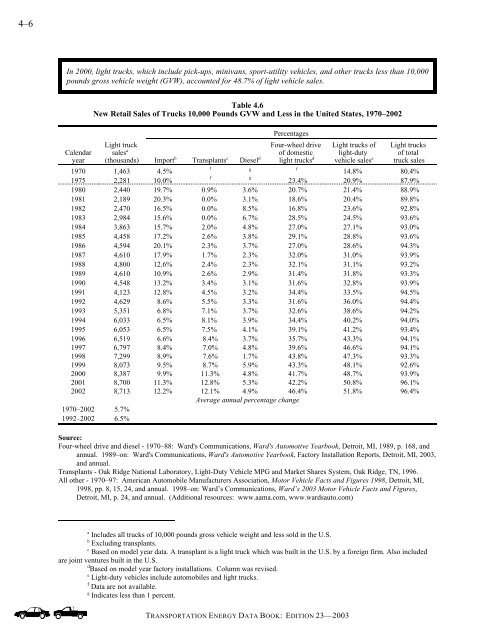
In 2000, light trucks, which include pick-ups, minivans, sport-utility vehicles, and other trucks less than 10,000<br />
pounds gross vehicle weight (GVW), accounted for 48.7% of light vehicle sales.<br />
Calendar<br />
year<br />
Table 4.6<br />
New Retail Sales of Trucks 10,000 Pounds GVW and Less in the United States, 1970–2002<br />
Light truck<br />
sales a<br />
(thousands) Import b Transplants c Diesel d<br />
a Includes all trucks of 10,000 pounds gross vehicle weight and less sold in the U.S.<br />
b<br />
Excluding transplants.<br />
c<br />
Based on model year <strong>data</strong>. A transplant is a light truck which was built in the U.S. by a foreign firm. Also included<br />
are joint ventures built in the U.S.<br />
d<br />
Based on model year factory installations. Column was revised.<br />
e Light-duty vehicles include automobiles and light trucks.<br />
f Data are not available.<br />
g Indicates less than 1 percent.<br />
Percentages<br />
Four-wheel drive<br />
of domestic<br />
light trucks d<br />
f g f<br />
TRANSPORTATION ENERGY DATA BOOK: EDITION <strong>23</strong>—2003<br />
Light trucks of<br />
light-duty<br />
vehicle sales e<br />
Light trucks<br />
of total<br />
truck sales<br />
1970 1,463 4.5%<br />
14.8% 80.4%<br />
1975 2,281 10.0%<br />
f g<br />
<strong>23</strong>.4% 20.9% 87.9%<br />
1980 2,440 19.7% 0.9% 3.6% 20.7% 21.4% 88.9%<br />
1981 2,189 20.3% 0.0% 3.1% 18.6% 20.4% 89.8%<br />
1982 2,470 16.5% 0.0% 8.5% 16.8% <strong>23</strong>.6% 92.8%<br />
1983 2,984 15.6% 0.0% 6.7% 28.5% 24.5% 93.6%<br />
1984 3,863 15.7% 2.0% 4.8% 27.0% 27.1% 93.0%<br />
1985 4,458 17.2% 2.6% 3.8% 29.1% 28.8% 93.6%<br />
1986 4,594 20.1% 2.3% 3.7% 27.0% 28.6% 94.3%<br />
1987 4,610 17.9% 1.7% 2.3% 32.0% 31.0% 93.9%<br />
1988 4,800 12.6% 2.4% 2.3% 32.1% 31.1% 93.2%<br />
1989 4,610 10.9% 2.6% 2.9% 31.4% 31.8% 93.3%<br />
1990 4,548 13.2% 3.4% 3.1% 31.6% 32.8% 93.9%<br />
1991 4,1<strong>23</strong> 12.8% 4.5% 3.2% 34.4% 33.5% 94.5%<br />
1992 4,629 8.6% 5.5% 3.3% 31.6% 36.0% 94.4%<br />
1993 5,351 6.8% 7.1% 3.7% 32.6% 38.6% 94.2%<br />
1994 6,033 6.5% 8.1% 3.9% 34.4% 40.2% 94.0%<br />
1995 6,053 6.5% 7.5% 4.1% 39.1% 41.2% 93.4%<br />
1996 6,519 6.6% 8.4% 3.7% 35.7% 43.3% 94.1%<br />
1997 6,797 8.4% 7.0% 4.8% 39.6% 46.6% 94.1%<br />
1998 7,299 8.9% 7.6% 1.7% 43.8% 47.3% 93.3%<br />
1999 8,073 9.5% 8.7% 5.9% 43.3% 48.1% 92.6%<br />
2000 8,387 9.9% 11.3% 4.8% 41.7% 48.7% 93.9%<br />
2001 8,700 11.3% 12.8% 5.3% 42.2% 50.8% 96.1%<br />
2002 8,713 12.2% 12.1% 4.9% 46.4% 51.8% 96.4%<br />
Average annual percentage change<br />
1970–2002 5.7%<br />
1992–2002 6.5%<br />
Source:<br />
Four-wheel drive and diesel - 1970–88: Ward's Communications, Ward's Automotive Year<strong>book</strong>, Detroit, MI, 1989, p. 168, and<br />
annual. 1989–on: Ward's Communications, Ward's Automotive Year<strong>book</strong>, Factory Installation Reports, Detroit, MI, 2003,<br />
and annual.<br />
Transplants - <strong>Oak</strong> <strong>Ridge</strong> <strong>National</strong> Laboratory, Light-Duty Vehicle MPG and Market Shares System, <strong>Oak</strong> <strong>Ridge</strong>, TN, 1996.<br />
All other - 1970–97: American Automobile Manufacturers Association, Motor Vehicle Facts and Figures 1998, Detroit, MI,<br />
1998, pp. 8, 15, 24, and annual. 1998–on: Ward’s Communications, Ward’s 2003 Motor Vehicle Facts and Figures,<br />
Detroit, MI, p. 24, and annual. (Additional resources: www.aama.com, www.wardsauto.com)


