

Transportation energy data book: edition 23 - Oak Ridge National ...
Transportation energy data book: edition 23 - Oak Ridge National ...
Transportation energy data book: edition 23 - Oak Ridge National ...

You also want an ePaper? Increase the reach of your titles
YUMPU automatically turns print PDFs into web optimized ePapers that Google loves.
TRANSPORTATION ENERGY DATA BOOK: EDITION 22—2002<br />
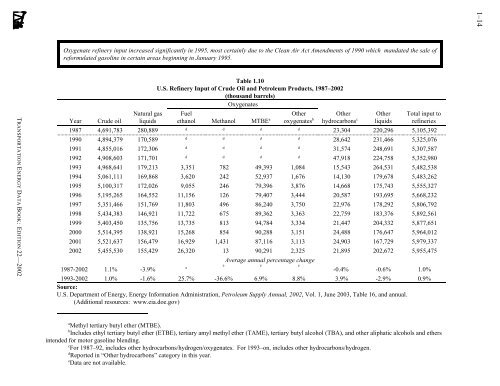
Oxygenate refinery input increased significantly in 1995, most certainly due to the Clean Air Act Amendments of 1990 which mandated the sale of<br />
reformulated gasoline in certain areas beginning in January 1995.<br />
Year Crude oil<br />
aMethyl tertiary butyl ether (MTBE).<br />
bIncludes ethyl tertiary butyl ether (ETBE), tertiary amyl methyl ether (TAME), tertiary butyl alcohol (TBA), and other aliphatic alcohols and ethers<br />
intended for motor gasoline blending.<br />
cFor 1987–92, includes other hydrocarbons/hydrogen/oxygenates. For 1993–on, includes other hydrocarbons/hydrogen.<br />
dReported in “Other hydrocarbons” category in this year.<br />
e Data are not available.<br />
Natural gas<br />
liquids<br />
Table 1.10<br />
U.S. Refinery Input of Crude Oil and Petroleum Products, 1987–2002<br />
(thousand barrels)<br />
Oxygenates<br />
Fuel<br />
ethanol Methanol MTBE a<br />
Other<br />
oxygenates b<br />
Other<br />
hydrocarbons c<br />
Other<br />
liquids<br />
Total input to<br />
refineries<br />
1987 4,691,783 280,889 d d d d <strong>23</strong>,304 220,296 5,105,392<br />
1990 4,894,379 170,589 d d d d 28,642 <strong>23</strong>1,466 5,325,076<br />
1991 4,855,016 172,306 d d d d 31,574 248,691 5,307,587<br />
1992 4,908,603 171,701 d d d d 47,918 224,758 5,352,980<br />
1993 4,968,641 179,213 3,351 782 49,393 1,084 15,543 264,531 5,482,538<br />
1994 5,061,111 169,868 3,620 242 52,937 1,676 14,130 179,678 5,483,262<br />
1995 5,100,317 172,026 9,055 246 79,396 3,876 14,668 175,743 5,555,327<br />
1996 5,195,265 164,552 11,156 126 79,407 3,444 20,587 193,695 5,668,<strong>23</strong>2<br />
1997 5,351,466 151,769 11,803 496 86,240 3,750 22,976 178,292 5,806,792<br />
1998 5,434,383 146,921 11,722 675 89,362 3,363 22,759 183,376 5,892,561<br />
1999 5,403,450 135,756 13,735 813 94,784 3,334 21,447 204,332 5,877,651<br />
2000 5,514,395 138,921 15,268 854 90,288 3,151 24,488 176,647 5,964,012<br />
2001 5,521,637 156,479 16,929 1,431 87,116 3,113 24,903 167,729 5,979,337<br />
2002 5,455,530 155,429 26,320 13 90,291 2,325 21,895 202,672 5,955,475<br />
1987-2002 1.1% -3.9% e<br />
Average annual percentage change<br />
e e e<br />
-0.4% -0.6% 1.0%<br />
1993-2002 1.0% -1.6% 25.7% -36.6% 6.9% 8.8% 3.9% -2.9% 0.9%<br />
Source:<br />
U.S. Department of Energy, Energy Information Administration, Petroleum Supply Annual, 2002, Vol. 1, June 2003, Table 16, and annual.<br />
(Additional resources: www.eia.doe.gov)<br />
1–14


