

Transportation energy data book: edition 23 - Oak Ridge National ...
Transportation energy data book: edition 23 - Oak Ridge National ...
Transportation energy data book: edition 23 - Oak Ridge National ...

Create successful ePaper yourself
Turn your PDF publications into a flip-book with our unique Google optimized e-Paper software.
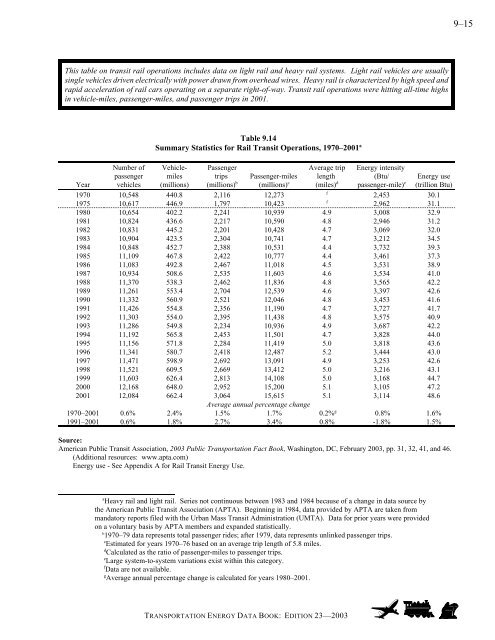
This table on transit rail operations includes <strong>data</strong> on light rail and heavy rail systems. Light rail vehicles are usually<br />
single vehicles driven electrically with power drawn from overhead wires. Heavy rail is characterized by high speed and<br />
rapid acceleration of rail cars operating on a separate right-of-way. Transit rail operations were hitting all-time highs<br />
in vehicle-miles, passenger-miles, and passenger trips in 2001.<br />
Table 9.14<br />
Summary Statistics for Rail Transit Operations, 1970–2001 a<br />
Number of Vehicle- Passenger<br />
passenger miles trips<br />
Year vehicles (millions) (millions) b<br />
Passenger-miles<br />
(millions) c<br />
Average trip<br />
length<br />
(miles) d<br />
Energy intensity<br />
(Btu/<br />
passenger-mile) e<br />
Energy use<br />
(trillion Btu)<br />
1970 10,548 440.8 2,116 12,273 f 2,453 30.1<br />
1975 10,617 446.9 1,797 10,4<strong>23</strong> f 2,962 31.1<br />
1980 10,654 402.2 2,241 10,939 4.9 3,008 32.9<br />
1981 10,824 436.6 2,217 10,590 4.8 2,946 31.2<br />
1982 10,831 445.2 2,201 10,428 4.7 3,069 32.0<br />
1983 10,904 4<strong>23</strong>.5 2,304 10,741 4.7 3,212 34.5<br />
1984 10,848 452.7 2,388 10,531 4.4 3,732 39.3<br />
1985 11,109 467.8 2,422 10,777 4.4 3,461 37.3<br />
1986 11,083 492.8 2,467 11,018 4.5 3,531 38.9<br />
1987 10,934 508.6 2,535 11,603 4.6 3,534 41.0<br />
1988 11,370 538.3 2,462 11,836 4.8 3,565 42.2<br />
1989 11,261 553.4 2,704 12,539 4.6 3,397 42.6<br />
1990 11,332 560.9 2,521 12,046 4.8 3,453 41.6<br />
1991 11,426 554.8 2,356 11,190 4.7 3,727 41.7<br />
1992 11,303 554.0 2,395 11,438 4.8 3,575 40.9<br />
1993 11,286 549.8 2,<strong>23</strong>4 10,936 4.9 3,687 42.2<br />
1994 11,192 565.8 2,453 11,501 4.7 3,828 44.0<br />
1995 11,156 571.8 2,284 11,419 5.0 3,818 43.6<br />
1996 11,341 580.7 2,418 12,487 5.2 3,444 43.0<br />
1997 11,471 598.9 2,692 13,091 4.9 3,253 42.6<br />
1998 11,521 609.5 2,669 13,412 5.0 3,216 43.1<br />
1999 11,603 626.4 2,813 14,108 5.0 3,168 44.7<br />
2000 12,168 648.0 2,952 15,200 5.1 3,105 47.2<br />
2001 12,084 662.4 3,064 15,615 5.1 3,114 48.6<br />
Average annual percentage change<br />
1970–2001 0.6% 2.4% 1.5% 1.7% 0.2% g<br />
0.8% 1.6%<br />
1991–2001 0.6% 1.8% 2.7% 3.4% 0.8% -1.8% 1.5%<br />
Source:<br />
American Public Transit Association, 2003 Public <strong>Transportation</strong> Fact Book, Washington, DC, February 2003, pp. 31, 32, 41, and 46.<br />
(Additional resources: www.apta.com)<br />
Energy use - See Appendix A for Rail Transit Energy Use.<br />
a<br />
Heavy rail and light rail. Series not continuous between 1983 and 1984 because of a change in <strong>data</strong> source by<br />
the American Public Transit Association (APTA). Beginning in 1984, <strong>data</strong> provided by APTA are taken from<br />
mandatory reports filed with the Urban Mass Transit Administration (UMTA). Data for prior years were provided<br />
on a voluntary basis by APTA members and expanded statistically.<br />
b1970–79 <strong>data</strong> represents total passenger rides; after 1979, <strong>data</strong> represents unlinked passenger trips.<br />
cEstimated for years 1970–76 based on an average trip length of 5.8 miles.<br />
dCalculated as the ratio of passenger-miles to passenger trips.<br />
eLarge system-to-system variations exist within this category.<br />
fData are not available.<br />
g Average annual percentage change is calculated for years 1980–2001.<br />
TRANSPORTATION ENERGY DATA BOOK: EDITION <strong>23</strong>—2003<br />
9–15


