

Transportation energy data book: edition 23 - Oak Ridge National ...
Transportation energy data book: edition 23 - Oak Ridge National ...
Transportation energy data book: edition 23 - Oak Ridge National ...

You also want an ePaper? Increase the reach of your titles
YUMPU automatically turns print PDFs into web optimized ePapers that Google loves.
4–2<br />
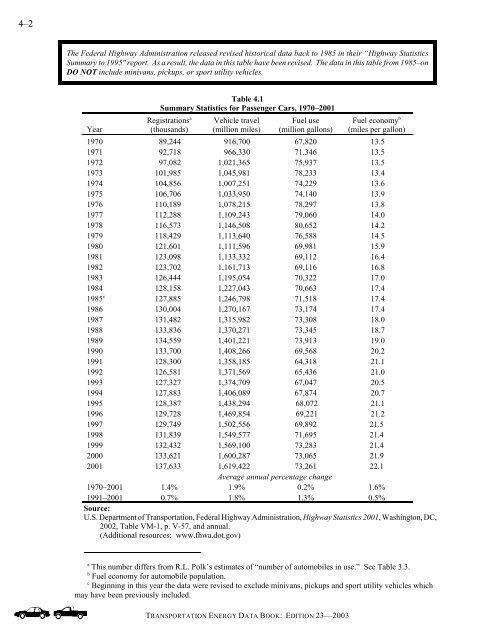
The Federal Highway Administration released revised historical <strong>data</strong> back to 1985 in their “Highway Statistics<br />
Summary to 1995" report. As a result, the <strong>data</strong> in this table have been revised. The <strong>data</strong> in this table from 1985–on<br />
DO NOT include minivans, pickups, or sport utility vehicles.<br />
Year<br />
a This number differs from R.L. Polk’s estimates of “number of automobiles in use.” See Table 3.3.<br />
b Fuel economy for automobile population.<br />
c Beginning in this year the <strong>data</strong> were revised to exclude minivans, pickups and sport utility vehicles which<br />
may have been previously included.<br />
Table 4.1<br />
Summary Statistics for Passenger Cars, 1970–2001<br />
Registrations a<br />
(thousands)<br />
Vehicle travel<br />
(million miles)<br />
Fuel use<br />
(million gallons)<br />
TRANSPORTATION ENERGY DATA BOOK: EDITION <strong>23</strong>—2003<br />
Fuel economy b<br />
(miles per gallon)<br />
1970 89,244 916,700 67,820 13.5<br />
1971 92,718 966,330 71,346 13.5<br />
1972 97,082 1,021,365 75,937 13.5<br />
1973 101,985 1,045,981 78,<strong>23</strong>3 13.4<br />
1974 104,856 1,007,251 74,229 13.6<br />
1975 106,706 1,033,950 74,140 13.9<br />
1976 110,189 1,078,215 78,297 13.8<br />
1977 112,288 1,109,243 79,060 14.0<br />
1978 116,573 1,146,508 80,652 14.2<br />
1979 118,429 1,113,640 76,588 14.5<br />
1980 121,601 1,111,596 69,981 15.9<br />
1981 1<strong>23</strong>,098 1,133,332 69,112 16.4<br />
1982 1<strong>23</strong>,702 1,161,713 69,116 16.8<br />
1983 126,444 1,195,054 70,322 17.0<br />
1984 128,158 1,227,043 70,663 17.4<br />
1985 c 127,885 1,246,798 71,518 17.4<br />
1986 130,004 1,270,167 73,174 17.4<br />
1987 131,482 1,315,982 73,308 18.0<br />
1988 133,836 1,370,271 73,345 18.7<br />
1989 134,559 1,401,221 73,913 19.0<br />
1990 133,700 1,408,266 69,568 20.2<br />
1991 128,300 1,358,185 64,318 21.1<br />
1992 126,581 1,371,569 65,436 21.0<br />
1993 127,327 1,374,709 67,047 20.5<br />
1994 127,883 1,406,089 67,874 20.7<br />
1995 128,387 1,438,294 68,072 21.1<br />
1996 129,728 1,469,854 69,221 21.2<br />
1997 129,749 1,502,556 69,892 21.5<br />
1998 131,839 1,549,577 71,695 21.4<br />
1999 132,432 1,569,100 73,283 21.4<br />
2000 133,621 1,600,287 73,065 21.9<br />
2001 137,633 1,619,422 73,261 22.1<br />
Average annual percentage change<br />
1970–2001 1.4% 1.9% 0.2% 1.6%<br />
1991–2001 0.7% 1.8% 1.3% 0.5%<br />
Source:<br />
U.S. Department of <strong>Transportation</strong>, Federal Highway Administration, Highway Statistics 2001, Washington, DC,<br />
2002, Table VM-1, p. V-57, and annual.<br />
(Additional resources: www.fhwa.dot.gov)


