

Transportation energy data book: edition 23 - Oak Ridge National ...
Transportation energy data book: edition 23 - Oak Ridge National ...
Transportation energy data book: edition 23 - Oak Ridge National ...

Create successful ePaper yourself
Turn your PDF publications into a flip-book with our unique Google optimized e-Paper software.
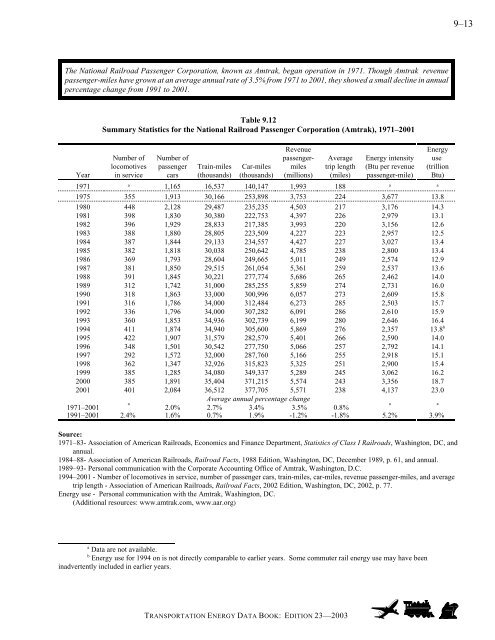
The <strong>National</strong> Railroad Passenger Corporation, known as Amtrak, began operation in 1971. Though Amtrak revenue<br />
passenger-miles have grown at an average annual rate of 3.5% from 1971 to 2001, they showed a small decline in annual<br />
percentage change from 1991 to 2001.<br />
Year<br />
Table 9.12<br />
Summary Statistics for the <strong>National</strong> Railroad Passenger Corporation (Amtrak), 1971–2001<br />
Number of<br />
locomotives<br />
in service<br />
Number of<br />
passenger<br />
cars<br />
Train-miles<br />
(thousands)<br />
Car-miles<br />
(thousands)<br />
Revenue<br />
passengermiles<br />
(millions)<br />
Average<br />
trip length<br />
(miles)<br />
a Data are not available.<br />
b Energy use for 1994 on is not directly comparable to earlier years. Some commuter rail <strong>energy</strong> use may have been<br />
inadvertently included in earlier years.<br />
TRANSPORTATION ENERGY DATA BOOK: EDITION <strong>23</strong>—2003<br />
Energy intensity<br />
(Btu per revenue<br />
passenger-mile)<br />
Energy<br />
use<br />
(trillion<br />
Btu)<br />
1971 a 1,165 16,537 140,147 1,993 188 a a<br />
1975 355 1,913 30,166 253,898 3,753 224 3,677 13.8<br />
1980 448 2,128 29,487 <strong>23</strong>5,<strong>23</strong>5 4,503 217 3,176 14.3<br />
1981 398 1,830 30,380 222,753 4,397 226 2,979 13.1<br />
1982 396 1,929 28,833 217,385 3,993 220 3,156 12.6<br />
1983 388 1,880 28,805 2<strong>23</strong>,509 4,227 2<strong>23</strong> 2,957 12.5<br />
1984 387 1,844 29,133 <strong>23</strong>4,557 4,427 227 3,027 13.4<br />
1985 382 1,818 30,038 250,642 4,785 <strong>23</strong>8 2,800 13.4<br />
1986 369 1,793 28,604 249,665 5,011 249 2,574 12.9<br />
1987 381 1,850 29,515 261,054 5,361 259 2,537 13.6<br />
1988 391 1,845 30,221 277,774 5,686 265 2,462 14.0<br />
1989 312 1,742 31,000 285,255 5,859 274 2,731 16.0<br />
1990 318 1,863 33,000 300,996 6,057 273 2,609 15.8<br />
1991 316 1,786 34,000 312,484 6,273 285 2,503 15.7<br />
1992 336 1,796 34,000 307,282 6,091 286 2,610 15.9<br />
1993 360 1,853 34,936 302,739 6,199 280 2,646 16.4<br />
1994 411 1,874 34,940 305,600 5,869 276 2,357 13.8b 1995 422 1,907 31,579 282,579 5,401 266 2,590 14.0<br />
1996 348 1,501 30,542 277,750 5,066 257 2,792 14.1<br />
1997 292 1,572 32,000 287,760 5,166 255 2,918 15.1<br />
1998 362 1,347 32,926 315,8<strong>23</strong> 5,325 251 2,900 15.4<br />
1999 385 1,285 34,080 349,337 5,289 245 3,062 16.2<br />
2000 385 1,891 35,404 371,215 5,574 243 3,356 18.7<br />
2001 401 2,084 36,512 377,705 5,571 <strong>23</strong>8 4,137 <strong>23</strong>.0<br />
Average annual percentage change<br />
1971–2001<br />
a<br />
2.0% 2.7% 3.4% 3.5% 0.8%<br />
a a<br />
1991–2001 2.4% 1.6% 0.7% 1.9% -1.2% -1.8% 5.2% 3.9%<br />
Source:<br />
1971–83- Association of American Railroads, Economics and Finance Department, Statistics of Class I Railroads, Washington, DC, and<br />
annual.<br />
1984–88- Association of American Railroads, Railroad Facts, 1988 Edition, Washington, DC, December 1989, p. 61, and annual.<br />
1989–93- Personal communication with the Corporate Accounting Office of Amtrak, Washington, D.C.<br />
1994–2001 - Number of locomotives in service, number of passenger cars, train-miles, car-miles, revenue passenger-miles, and average<br />
trip length - Association of American Railroads, Railroad Facts, 2002 Edition, Washington, DC, 2002, p. 77.<br />
Energy use - Personal communication with the Amtrak, Washington, DC.<br />
(Additional resources: www.amtrak.com, www.aar.org)<br />
9–13


